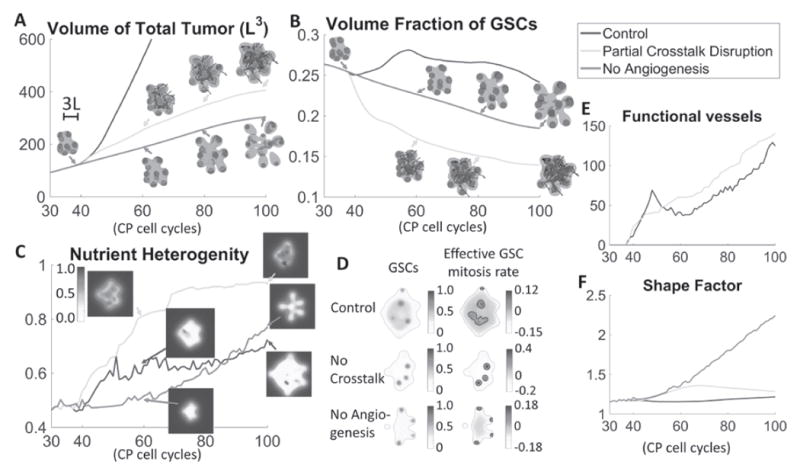
Fig. 4.

Treatment of vascularized GBM. (A) Time evolution of total tumor volumes. Treatments that partially disrupt VEC-GSC crosstalk by blocking VEC secretion of the GSC promoter F (green) or angiogenesis (red) reduce tumor size compared to Control (blue, tumor from Fig. 1). (B) Blocking angiogenesis prevents the formation of a GSC cluster at the tumor center and reduces the GSC fraction. Blocking VEC-GSC crosstalk removes the positive feedback on GSC self-renewal and further reduces GSC fraction. (C) Time evolution of average nutrient concentration in the tumor. Insets show slices of the nutrient distribution at the tumor center. (D) Slices of GSC mitosis rate at T=80 for the indicated tumors. Green: tumor boundary. Black: contours of . Blocking the crosstalk reduces the effective GSC mitosis at the tumor center, and GSC clusters are located off the tumor boundary due to higher nutrient levels at the center (see insets in (C)). (E) Between T=50 and T=60 in Control, pressure-induced vessel crushing reduces functional vessels, which recover after T=60. The functional vessels in tumors with VEC-GSC crosstalk blocked steadily increases. (F) Blocking angiogenesis promotes finger development and significantly increases the tumor shape factor. Blocking the VEC-GSC crosstalk increases the shape factor at early times. At later times, GSC clusters are located closer to tumor center and fingers cease to grow, which reduces the shape factor.
