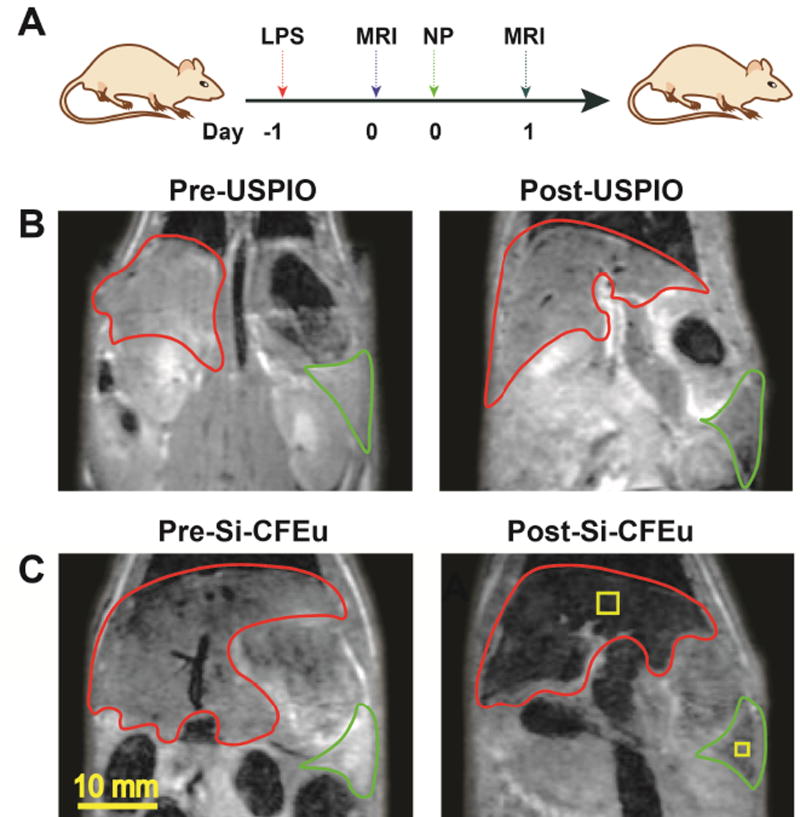
Fig. 8. Assessments of Si-CFEu and USPIO nanoparticle biodistribution by MRI tests.
(A) The time line of the experimental procedure is shown (LPS: Lipopolysaccharide, 5 mg/kg; MRI: magnetic resonance imaging scaning: NP: Nanoparticles). The representative T2 maps of magnetic resonance (MR) images of rats (B) with pre-(left) and 24 hours after (right) 1 mg iron/kg IV administration of USPIO nanoparticle and (C) Si-CFEu nanoparticles, respectively (red: liver and green:spleen).

