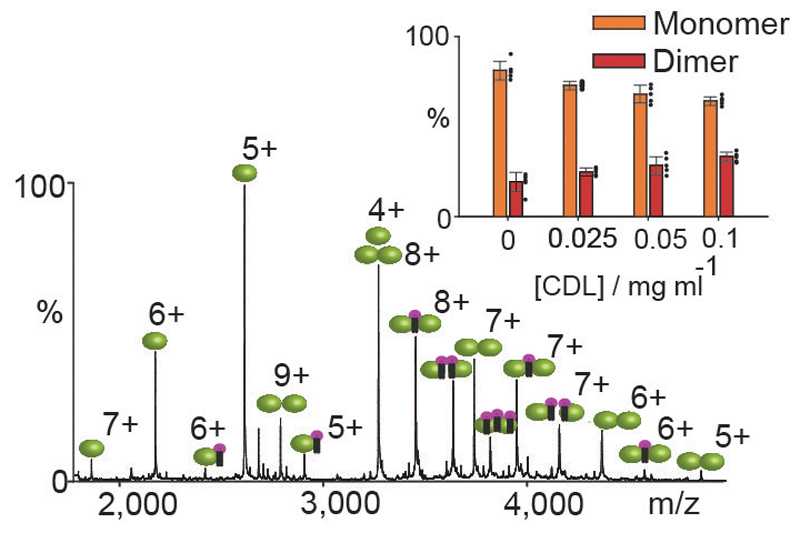
Figure 3. Mass spectrum recorded for SemiSWEET and the effect of cardiolipin on the monomer dimer equilibrium.
Mass spectrum of SemiSWEET following incubation with cardiolipin (CDL, purple head-groups). Plot of CDL concentration (mg ml-1) versus the percentage of monomer or dimer observed in mass spectra at various CDL concentrations (bars represent n=5 data points denoted with black dots, the error bars denotes the standard deviation).

