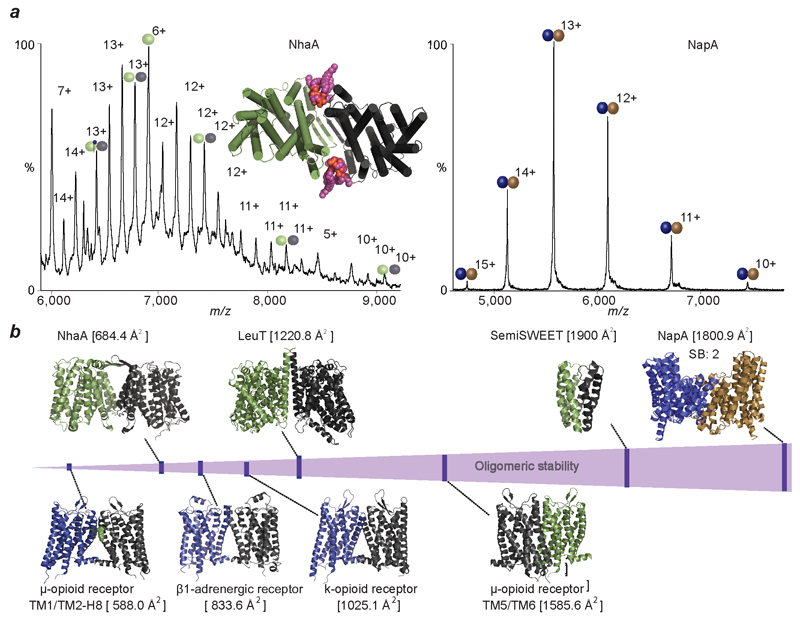
Figure 4. Comparison of mass spectra of NhaA with NapA and plot of stabilities of transporters studied here with G-protein coupled receptors.
a, Mass spectrum of NhaA (green/grey spheres), liberated from C8E4 micelles, reveals binding of cardiolipin (CDL, purple head-groups) and phospholipids (PL, blue head-groups) to the intact NhaA dimers. MD simulation of NhaA (green/black rods) in an E. coli lipid bilayer (inset) reveals interfacial CDL binding (orange/purple spheres). Mass spectrum of dimeric NapA (right), liberated from C8E4 micelles, shows NapA dimers without lipid binding (blue/brown spheres). b, Oligomeric stability scale (purple) annotated with crystal structures of proteins studied here (above) and GPCRs (below). Buried surface area is shown in parenthesis and number of salt bridges (SB) is shown for NapA. PDB IDs: 2A65 (LeuT), 4QND (SemiSWEET), 4AU5 (NhaA), 4BWZ (NapA), 4GPO (β1 adrenergic receptor), 4DKL (μ-opioid receptor), 4DJH (κ-opioid receptor).

