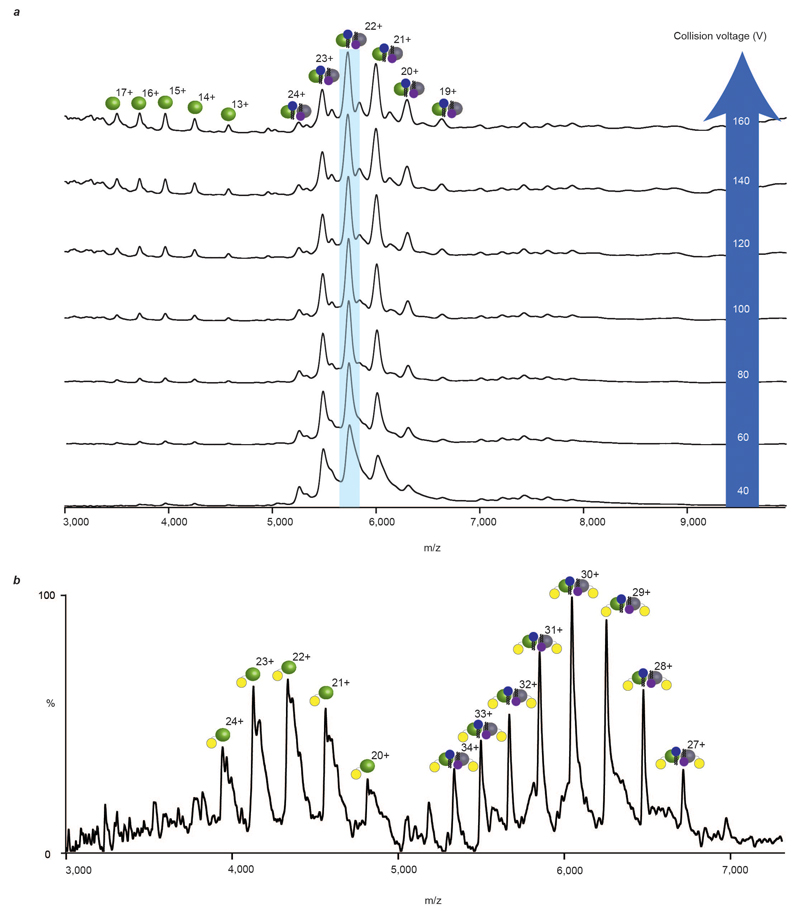
Extended Data Figure 1. Mass spectra of LeuT recorded with increasing collision voltages and of a LeuT fusion protein construct.
a, Mass spectra of LeuT, liberated from OG micelles, (green/grey spheres, most abundant charge state highlighted in pale blue), show that the 7.4 kDa lipid adduct (blue/purple head groups) is retained throughout the trap collision energy range (white, blue arrow) of the mass spectrometer. b, Mass spectra of LeuT expressed as a fusion protein with eYFP (LeuT-eYFP yellow circles), liberated from OG micelles, show that the dimer is similarly associated with a 7.4 kDa adduct.

