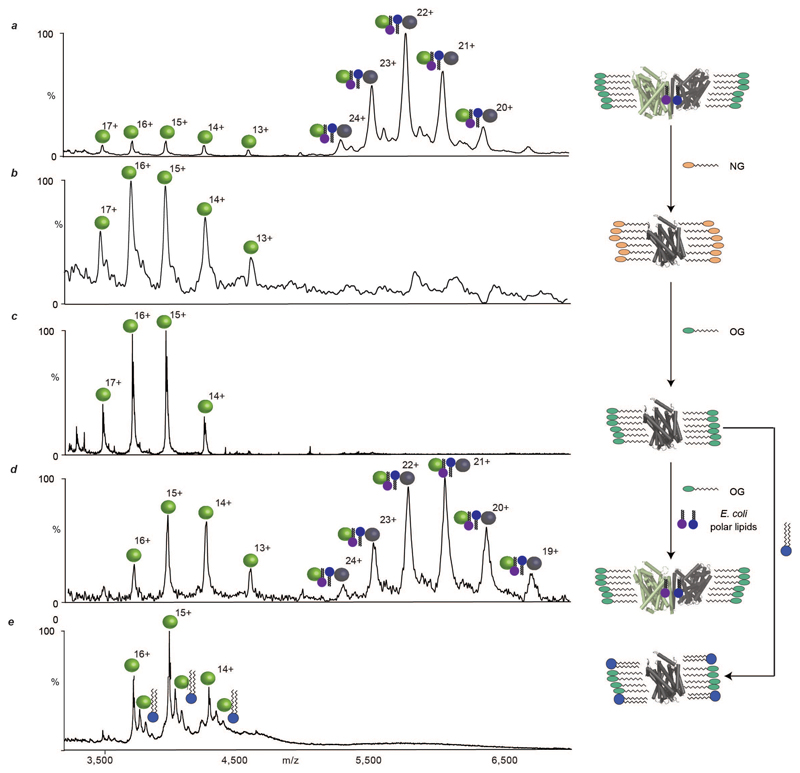
Extended Data Figure 2. Mass spectra of LeuT following incubation with delipidating detergents and E. coli polar lipids.
a, Mass spectrum of LeuT liberated from OG micelles (green head groups) shows low-abundance, delipidated monomers (green spheres, 59.3 kDa) and high-abundance, lipid-bound dimers (green/black spheres, 126.0 kDa). b, Mass spectrum of LeuT after incubation with neopentyl glycol (NG, orange head-groups) shows only delipidated monomers. c, Mass spectrum of LeuT in OG, after incubation with NG, shows only delipidated monomers. d, Mass spectrum recorded after incubation of delipidated LeuT monomers, in OG, with E. coli polar lipids (blue/purple head-groups) shows delipidated monomers and lipid-bound dimers. e, Mass spectrum recorded after adding dilysocardiolipin (blue head-groups) to delipidated monomeric LeuT in OG (c) shows no dimerisation in the presence of this lipid.

