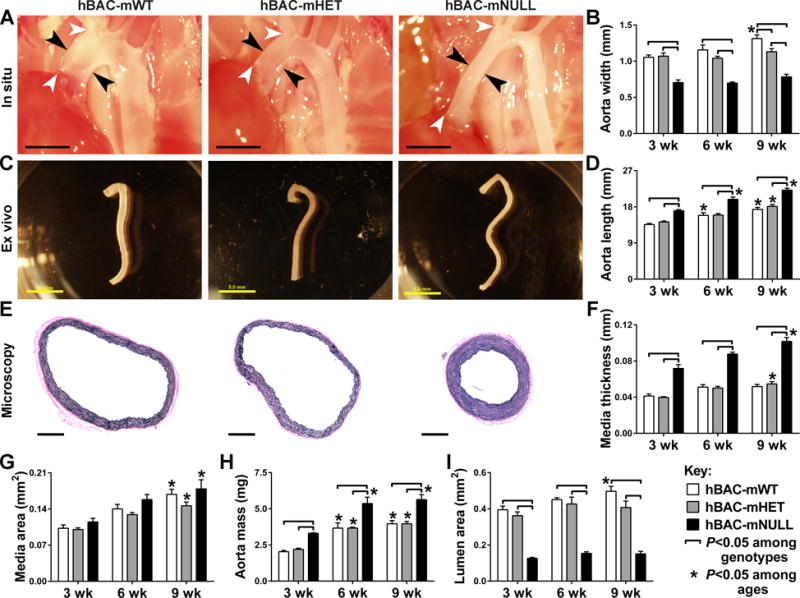
Figure 1.

Thoracic Aorta Dimensions and Mass in hBAC-mWT (white bars), hBAC-mHET (gray bars), and hBAC-mNULL (black bars) mice. (A) Representative images of the ascending aorta in situ at 9 weeks of age with the width (i.e., external diameter) delineated between black arrows and the length between white arrows (bars: 2 mm). (B) In situ measurements of ascending aorta width at 3, 6, and 9 weeks. (C) Representative images of the thoracic aorta ex vivo at 9 weeks of age (bars: 5 mm). (D) In situ measurements of thoracic aorta length at 3, 6, and 9 weeks. (E) Representative cross-sectional images of EVG-stained ascending aorta at 9 weeks of age (bars: 500 μm). (F) Microscopic measurements of ascending aorta medial thickness at 3, 6, and 9 weeks. Measurements of (G) ascending aorta medial area, (H) thoracic aorta mass, and (I) ascending aorta lumen area at 3, 6, and 9 weeks. Data represent mean ± SEM; n = 3 (6 weeks) to 6 (3 and 9 weeks); ⎴ P < 0.05 among genotypes and *P < 0.05 among ages; two-way ANOVA.
