
Fig. 4.
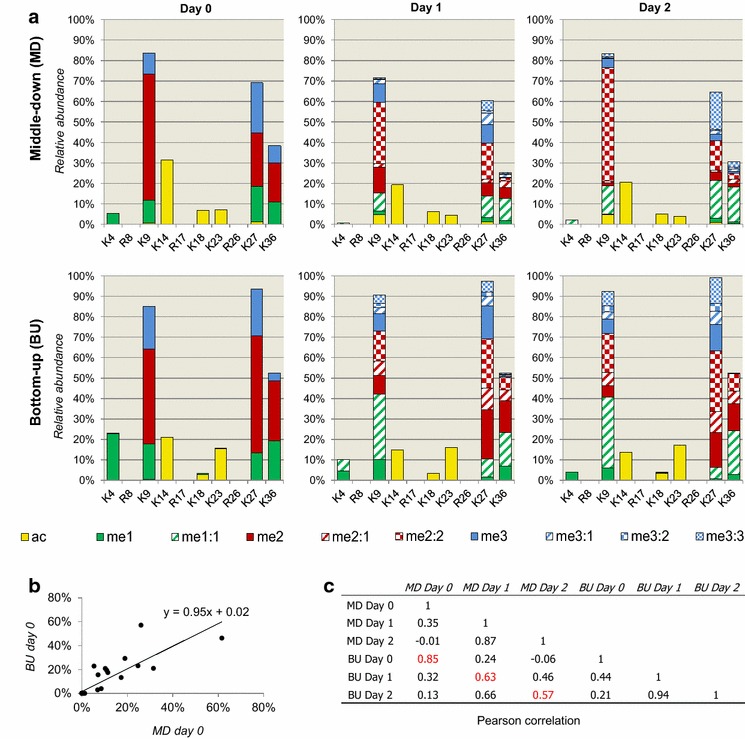
Comparison of single PTM quantification obtained from the middle-down and the bottom-up MS analysis. a Relative abundance of single histone PTMs quantifiable by both middle-down (top) and bottom-up (bottom) MS strategies. The relative abundance of single PTMs was obtained by summing the relative abundance of all combinatorial forms containing each given PTM. b Example of correlation between the day 0 results of bottom-up and middle-down MS. c Pearson’s correlation values between the described runs. Averages of biological replicates were used for the comparison; in red, correlation of the same time point of middle-down versus bottom-up MS