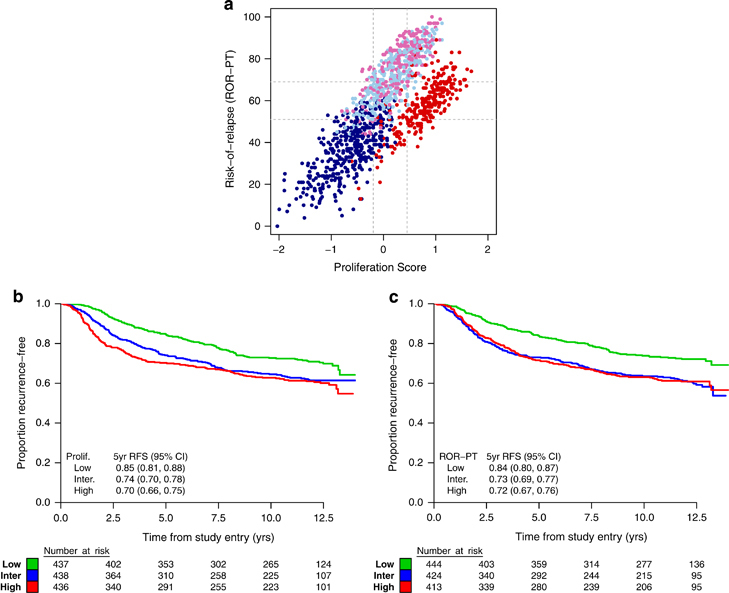
Figure 3.

(a) Scatterplot of proliferation and ROR-PT scores labeled by intrinsic subtype: basal-like (red), HER2-E (pink), LumA (dark blue), and LumB (light blue). Cutpoints that divide each score into tertiles are shown in gray. (b) Kaplan–Meier plot and 5-year RFS estimates for the low, intermediate (inter.), and high subgroups of proliferation (prolif.) scores. (c) Kaplan–Meier plot and 5-year RFS estimates for the low, intermediate, and high subgroups of ROR-PT scores. CI, confidence interval; RFS, recurrence-free survival; ROR-PT, risk of recurrence score.
