Fig. 3.

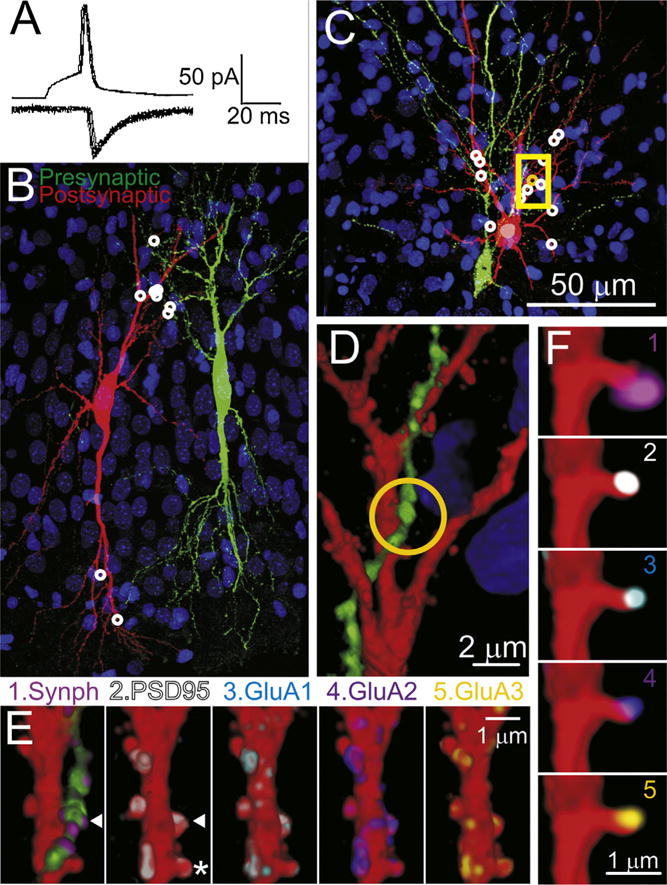
Reconstruction of synaptically-connected CA3 neurons pairs with two different fixations procedures to improve time resolution. (A) Recordings for the pre-synaptic action potentials (upper trace) and postsynaptic AMPAR-mediated synaptic currents (lower traces), taken from the cell pair illustrated in panels (C–F). Shown are 8 consecutive action potentials and corresponding postsynaptic responses. (B) A partial volume reconstruction (144 100 nm sections thick). 9 synaptic contacts (white circles) were found within this volume. This pair of cells were fixed by the standard room temperature/overnight method. (C) Another partial volume reconstruction from a pair of CA3 cells fixed at 80 °C for 2 min. This volume was reconstructed from 367 serial sections and this volume contained 13 synapses white/yellow circles. (D) A magnified view of a portion of this volume (35 sections) indicated by the yellow box in (C). (E) Magnified view of one dendritic segments (20 sections). The arrow head indicates the location of the synapse indicated by the orange circle in panel (C) and (D). E1 shows the pre- and postsynaptic injected markers (red and green) and immunostaining for synaptophysin (violet). (E2–6) show the dendrite with the presynaptic axon digitally removed from the image and immunostained for PSD95 (2), GluA1 (3), GluA2 (4) or GluA3 (5). (F) Four panels showing detail of the dendritic spine marked by an * in panel (E2), 3 sections thick, and immunostained with the same markers (1–5) as in panel (E). This spine, is viewed from behind the perspective or panel (E) (i.e., the sections stacked in reverse order). (For interpretation of the references to color in this figure legend, the reader is referred to the web version of this article.)
