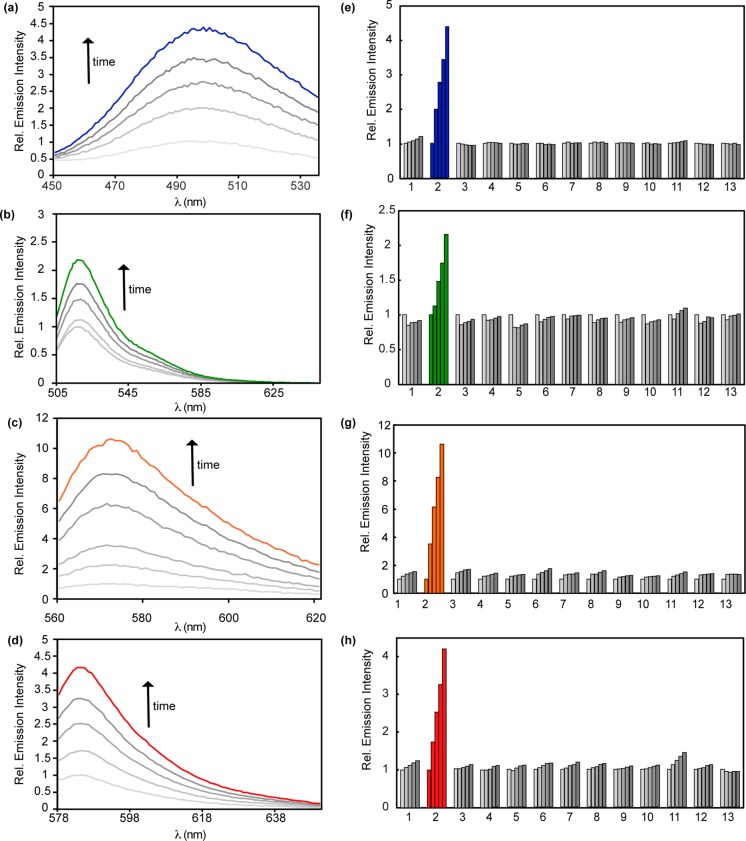
Figure 3.
Fluorescence responses and selectivities of FA probes. (a–c) Fluorescence responses of 10 μM (a) FAP385, (b) FAP498, (c) FAP555, or (d) FAP573 to 100 μM FA. Data were acquired in 20 mM PBS (pH 7.4) at 37 °C. Emission was collected between (a) 450–535 nm (λex = 385 nm), (b) 505–645 nm (λex = 498 nm), (c) 560–625 nm (λex = 555 nm) or (d) 578–650 nm (λex = 573 nm). Lines represent time points taken at 0 (lightest gray), 30 (light gray), 60 (gray), 90 (dark gray), and 120 min (colored) after addition of 100 μM FA. (e–h) Fluorescence responses of 10 μM probe to RCS or relevant biological analyte. Bars represent emission intensity responses to 100 μM analyte unless otherwise stated for 0 (lightest gray), 30 (light gray), 60 (gray), 90 (dark gray), and 120 (darkest gray) min, except FA, which is shown in colored bars. Analytes were prepared as stated in the Selectivity Tests section of the SI. Legend: (1) PBS, (2) FA, (3) acetaldehyde, (4) glucose (1 mM), (5) 4-hydroxynonenal, (6) dehydroascorbate, (7) glucosone, (8) pyruvate, (9) oxaloacetate, (10) acrolein, (11) methylglyoxal, (12) H2O2, (13) glutathione (5 mM).

