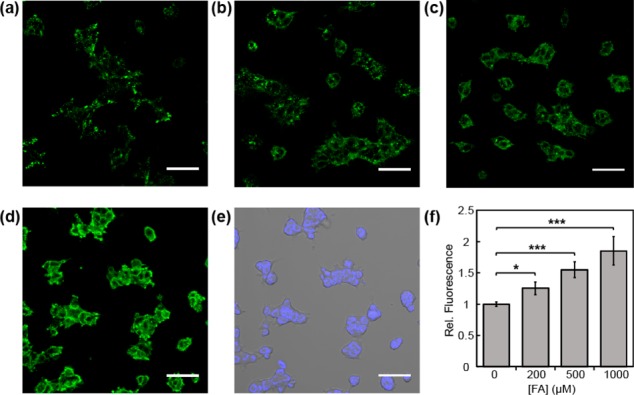
Figure 4.

Confocal microscopy images of FAP498 in response to exogenous FA addition in HEK293T cells. Cells were treated with 5 μM FAP498 in BSS buffer for 30 min, exchanged into fresh buffer, and then treated with (a) vehicle, (b) 200, (c) 500, or (d) 1000 μM FA. Images were taken after 60 min. (e) Bright field image of cells in (d) overlaid with 1 μM Hoechst 33342. (f) Mean fluorescent intensities of cells in (a–d) 60 min after addition of FA relative to mean fluorescence intensity before addition of vehicle or FA; error bars denote SEM (n = 3). *P < 5 × 10⁻³, ***P < 5 × 10⁻⁵. Scale bar represents 50 μm in all images.
