Figure 8.

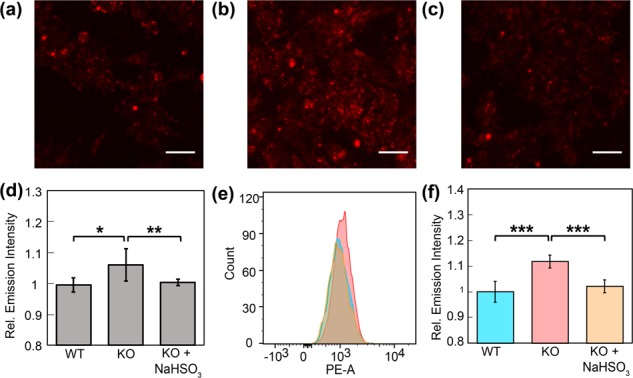
Confocal microscopy images (a–c) and flow cytometry histograms (e) of FAP573 in response to basal FA levels in (a) WT, (b) ADH5 KO, and (c) ADH5 KO HAP1 cells with 200 μM NaHSO3. (a,b) Cells were treated with 1 μM FAP573 for 30 min, then exchanged into fresh buffer. (c) Cells were treated with 200 μM NaHSO3 for 30 min, and then as in (a,b) keeping 200 μM NaHSO3 present in all buffers. Images were taken after 60 min. (d) Mean fluorescent intensities of cells in (a–c) 60 min after addition of FAP573 to mean fluorescence intensity of cells in (a). (e) Representative flow cytometry experiment of 1 μM FAP573 incubated in WT (blue), ADH5 KO (red) or KO cells with NaHSO3 (orange) for 1 h. (f) Mean fluorescence intensity of median PE-A fluorescence relative to fluorescence intensity of median PE-A in the WT cells; error bars denote SEM (n = 3). *P < 5 × 10⁻³, **P < 5 × 10⁻⁴. ***P < 5 × 10⁻⁵. Scale bar represents 50 μm in all images.
