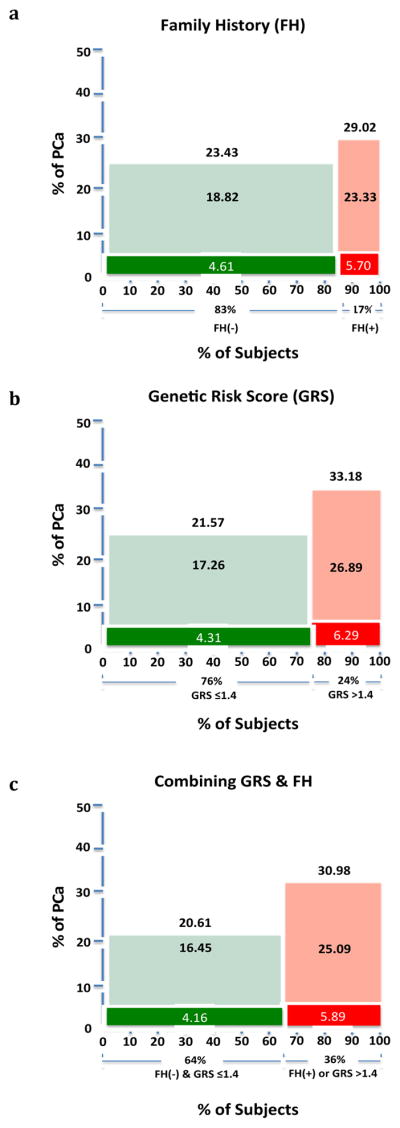
Figure 1.

The detection rate of PCa and high-grade PCa among men defined as higher or lower risk based on family history alone (a), genetic risk score alone (b), and a combination of family history and genetic risk score. Green and red color represents men at lower or higher risk, respectively. Darker colors represent high-grade PCa.
