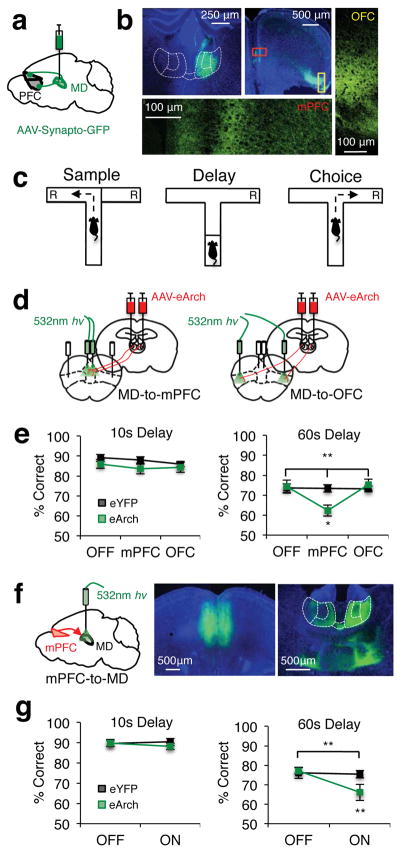
Figure 1. Reciprocal MD-mPFC activity is required for spatial working memory.
(a) Schema of viral delivery of AAV1-CBA-Synaptophysin-GFP for visualization of MD-to-PFC synaptic contacts. (b) Top left: Representative expression of synaptophysin-GFP in MD cell bodies. Top Middle: Synaptophysin-GFP+ MD terminals in PFC. Bottom/Right: Confocal images of synaptophysin-GFP+ MD terminals in medial prefrontal (bottom; mPFC) and dorsolateral orbitofrontal cortex (right; OFC). (c) Schema of a single trial of the DNMS T-maze. “R” indicates reward locations. (d) Schema of viral delivery of AAV5-hSyn-eArch3.0-eYFP to MD and illumination of MD-to-mPFC (left) or MD-to-OFC (right) terminals within single animals. (e) Percent correct performance in the DNMS T-maze at 10s (left) or 60s (right) delays in eYFP (black trace) and eArch-expressing (green trace) mice (eYFP n=13; eArch n=12; 10s data: 2-tailed, rmANOVA light x group, p=0.67; 60s data: 2-tailed, rmANOVA light x group, **p=0.003, F(2,46)=6.73; 2-tailed, paired t-test eArch OFF vs. mPFC, *p=0.02, t(11)= −2.74). (f) Left: Schema of viral delivery of eArch-eYFP or eYFP to the mPFC and illumination of mPFC-to-MD terminals. Middle: Representative viral expression in mPFC cell bodies. Right: mPFC terminals projecting to the MD (outlined in white and parceled by lateral, central and medial subnuclei). (g) As in e but for mice receiving mPFC-to-MD terminal illumination (eYFP n=13; eArch n=14; 10s data: 2-tailed, rmANOVA light x group, p=0.35; 60s data: 2-tailed, rmANOVA light x group, **p=0.002, F(1,25)=12.1; 2-tailed, paired t-test eArch light ON vs. OFF, **p=0.001, t(13)=4.19). Error bars depict SEM throughout.

