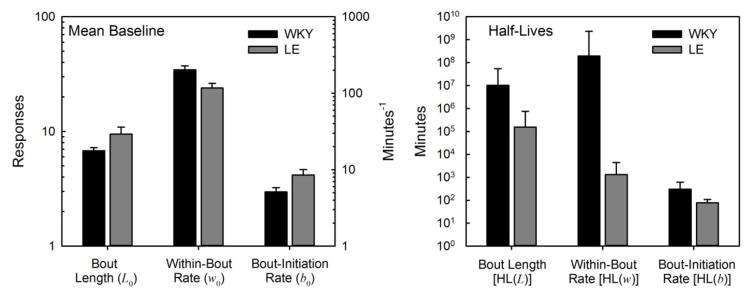
Figure 2.
Mean (±SEM) estimates of DBERM baseline parameters (left panel) and their half-lives (right panel) during MAINT, for WKY (black columns) and LE (gray columns) rats. Baseline bout length (L0) is reported in number of responses (left y-axis), and excludes the bout-initiating response. Baseline rates are reported in responses (w0) and bouts (b0) per minute (min−1, right y-axis). Half-lives [HL(L), HL(w), and HL(b)] are reported in minutes.

