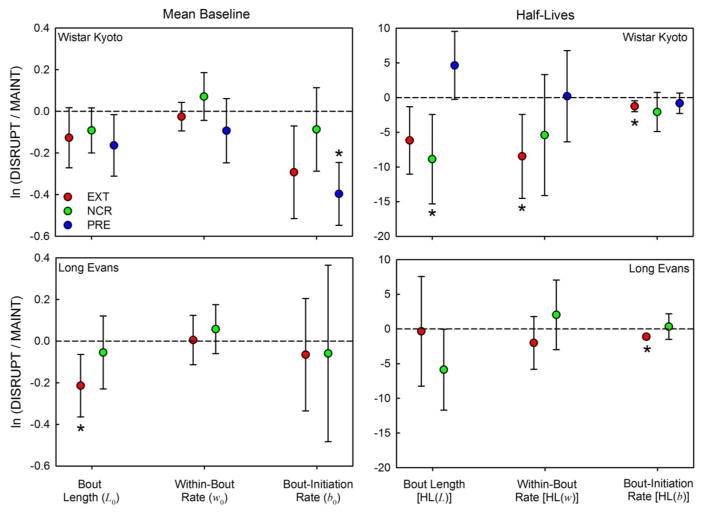
Figure 3.
Mean (±99% CI) log-transformed ratios of estimated disrupted DBERM parameters (left panels) and their half-lives (right panels) relative to preceding maintenance estimates, for WKY (top panels) and LE (bottom panels) rats. Each disrupter is identified with a symbol of a different color. Asterisks indicate significant changes in estimates between disruption and preceding maintenance, p < 0.0085 (Type I error rate = 5% with Dunn–Šidák correction for 6 comparisons). There was no PRE disruption in Experiment 2.

