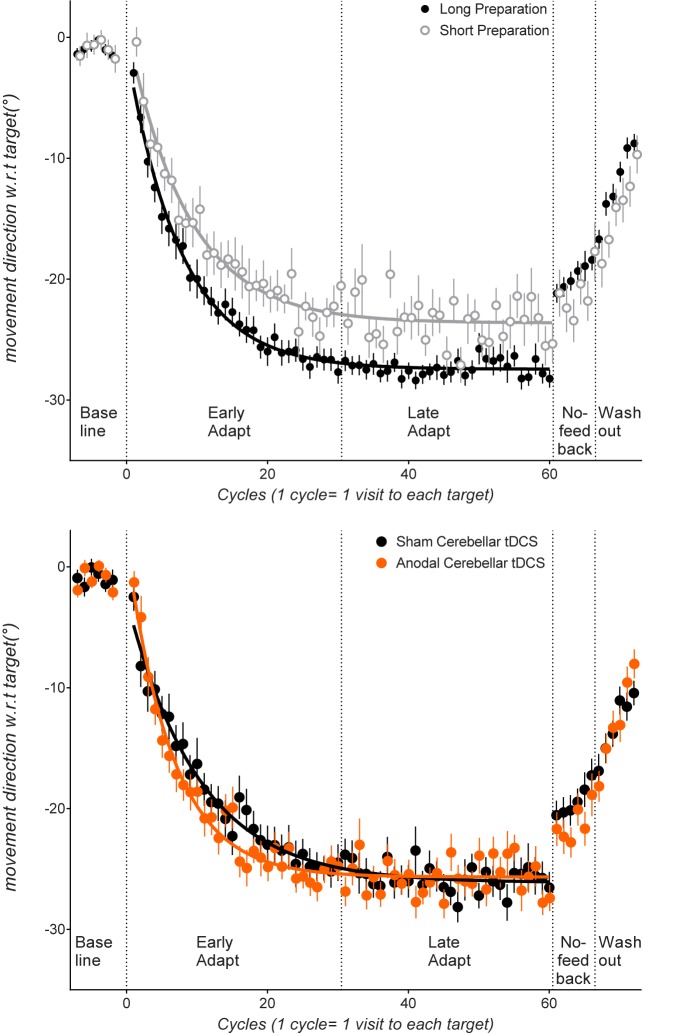
Fig 1. Top panel: Cycle by cycle movement directions relative to the target, averaged across the short preparation time groups (clear circles), and the long preparation time groups (grey circles) (i.e., pooled across the cerebellar tDCS anodal and sham conditions).
Bottom panel: cycle by cycle movement direction relative to the target, averaged across all participant groups who received cerebellar sham tDCS and cerebellar anodal tDCS (i.e., pooled across long and short preparation time groups). Data from the counterclockwise rotation groups were sign-transformed to allow statistical comparisons between clockwise and counterclockwise groups. In the adaptation block, values closer to -30° indicate more complete error compensation. In the no-feedback block, values closer to -30° indicate more implicit remapping, as participants were instructed that the rotation was removed, and that they were to aim straight towards the target without visual feedback of their movement. Error bars indicate standard errors of the mean. Lines indicate group mean data fit to the single-rate exponential function for the adaptation phase.

