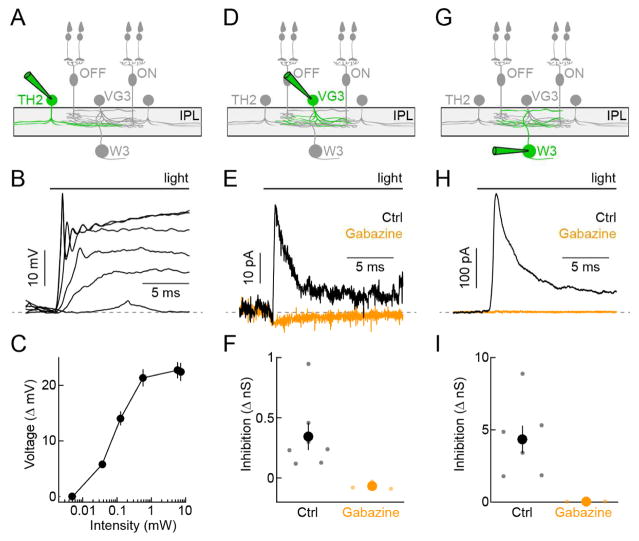
Figure 2. Optogenetic mapping of TH2-AC connectivity.
(A, D, G) Schematics illustrating the W3-RGC circuit with cell type recorded in the panels below highlighted (green). (B and C) Representative traces (B) and summary data (C, mean ± SEM, n = 6) of TH2-AC voltage responses to increasing optogenetic stimulus intensities presented in a 2-mm diameter spot (TH-Cre Ai32). To map connectivity stimuli of 0.57 mW were used. (E and F) Representative traces (E) and summary data (F) of IPSCs (Vhold = 0 mV) recorded in VG3-ACs during optogenetic stimulation of TH2-ACs (TH-Cre VG3-Cre Ai32) in the control conditions (black) and in the presence of gabazine (orange). In (F), each dot represents data from individual cells and the larger circles (errorbars) indicate the mean (± SEM) of the respective populations (control, n = 7, gabazine n = 4, p = 0.006). (H and I) Analogous to E (H) and F (I), but for IPSCs recorded from W3-RGCs (TH-Cre Ai32, control n = 7, gabazine n = 3, p = 0.016). TH2-AC-driven IPSCs are approximately 10-fold larger in W3-RGCs than in VG3-ACs (p = 5.8 × 10⁻⁴).

