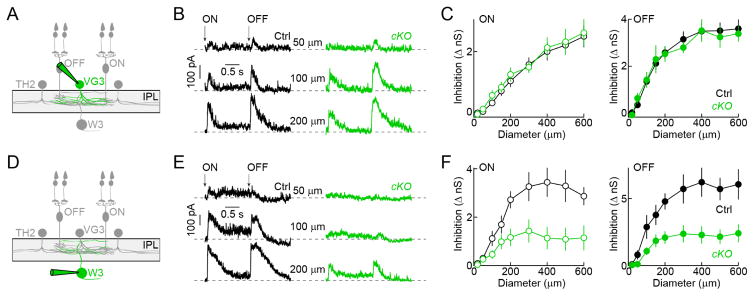
Figure 3. Silencing of TH2-ACs reveals preferential inhibition to theW3-RGCs.
(A and D) Schematic illustrating the W3-RGC circuit with the cell type recorded in the panels to the right highlighted (green). (B and C) Representative traces (B) and summary data (C, mean ± SEM) of VG3-AC IPSCs elicited stationary ON and OFF stimuli of increasing size (i.e. spot diameter). Recordings from mice in which TH2-ACs lack VGAT (TH-Cre VG3-Cre VGATcKO Ai9, cKO, green, n = 10) and control mice (TH-Cre VG3-Cre Ai9, black, Ctrl, n = 24,) are compared (ON: p = 0.94, OFF: p = 0.902). (E and F) Analogous to B (E) and C (F), but for recordings of IPSCs in W3-RGCs, which are reduced when TH2-ACs are silenced (TH-Cre VGATcKO, cKO, green, n = 13) compared to when TH2-ACs are active (TH-Cre, Ctrl, black, n = 10, ON: p = 0.012, OFF: p = 0.006). See also Figures S3 and S4.

