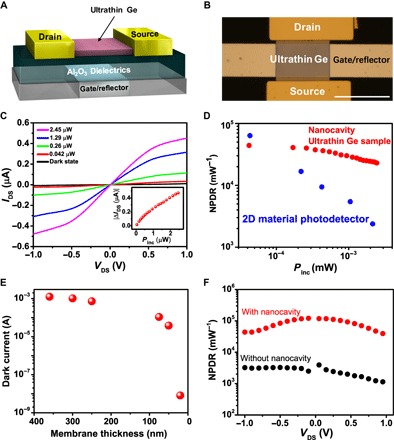
Fig. 3. I-V measurements of ultrathin Ge photodetector under both dark and illuminated conditions.

(A) Schematic of an ultrathin Ge photodetector on a nanocavity. (B) Optical microscopy image of ultrathin Ge photodetector. Scale bar, 50 μm. (C) I-V curves of the p-type Ge photoconductor under dark (black curve) and illuminated (colored curves) conditions. Inset: The photocurrent shows a linear relationship with the illuminated power. (D) Calculated normalized photocurrent–to–dark current ratio (NPDR) with the illuminated power and its comparison with a MoS2 photodetector. (E) Dark current of Ge membranes with different thicknesses (that is, 360, 300, 250, 75, 50, and 20 nm) under the bias of 1 V. (F) NPDR comparison between the Ge photodetectors with and without nanocavity structure (GeOI-based).
