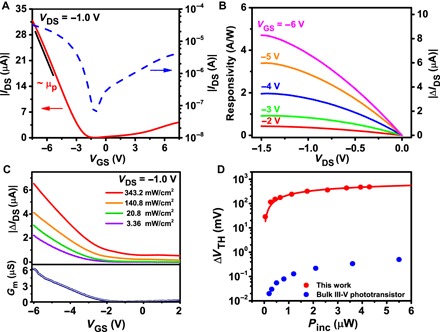
Fig. 4. Measurements of ultrathin Ge phototransistor and its analysis.

(A) Transfer curves (VGS-IDS) of the ultrathin Ge transistor. (B) Photoresponsivity and VDS-IDS curves of the ultrathin Ge phototransistor under the illumination power density of 140.8 mW/cm2. The peak photoresponsivity is 4.7 A/W. (C) Top: Ultrathin Ge transistor photocurrent (|ΔIDS|) as a function of VGS under various power conditions: 3.36 (purple), 20.8 (green), 140.8 (orange), and 343.2 mW/cm2 (red), respectively. Bottom: Transconductance (|Gm|) of ultrathin Ge transistors. (D) Comparison of threshold voltage change (ΔVTH) of the ultrathin Ge phototransistor with that of the epitaxial-based III-V phototransistor. The measured ΔVTH values are obtained by subtracting the threshold voltages extracted from the VGS-IDS curves under the illuminated and dark conditions (fig. S9). The solid curve is plotted using the empirical equation for ΔVTH.
