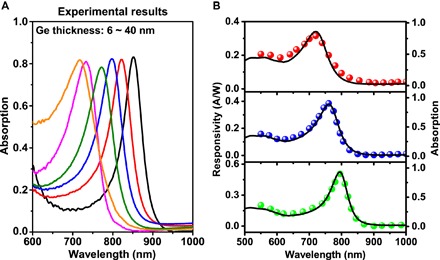
Fig. 5. Absorption measurements of ultrathin Ge sample with varying thickness (from 6 to 40 nm) on the same chip and the spectral photocurrent response.

(A) Absorption spectra measured by Fourier transform infrared spectroscopy of the ultrathin Ge sample. The peak wavelength becomes larger as the Ge nanomembrane thickness changes from 6 to 40 nm. (B) Left axis: Photoresponsivity (A/W) results of three different samples on the same 220-nm-thick Al2O3/Ag substrate. The thicknesses of Ge films are (from top to bottom) 12, 17, and 26 nm, respectively. Right axis: Simulated absorption spectra of these three samples, with the same structure parameters mentioned above. The simulation is based on full-wave Maxwell’s equations.
