Fig. 1.

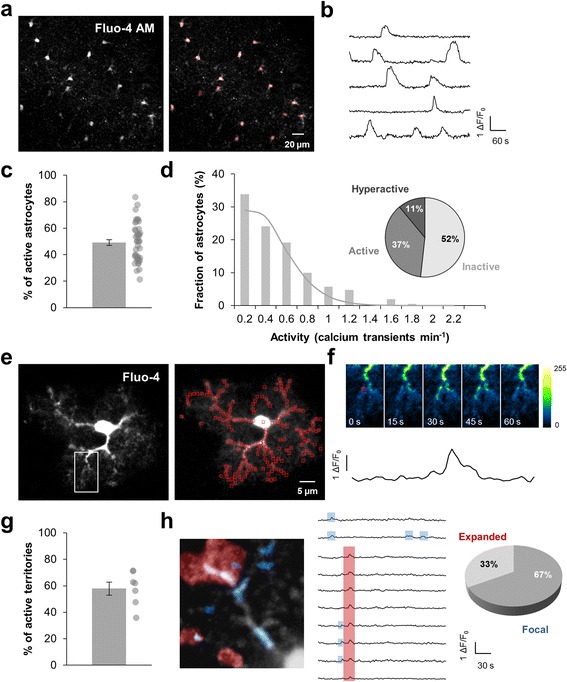
Detection of global and compartmentalized Ca2+ events in astrocytes. a Fluo-4-loaded astrocytes in the stratum radiatum of a mouse coronal slice. Fluorescence variations were analyzed in astrocyte cell bodies (red square). b Example of typical fluorescence variations recorded in physiological condition. c Proportion of astrocytes displaying calcium activity during a 5-min recording. Each dot corresponds to individual value for each recorded slice (n = 43). d Frequency histogram showing the occurrence of Ca2+ events in the astrocyte population and the related theoretical Poisson distribution (grey curve). Pie chart representing inactive (0 event per min), active (0.2–0.6 event per min) and hyperactive (> 0.6 event per min) astrocytes in physiological condition. e Single patch-clamp Fluo-4-loaded astrocyte in the stratum radiatum of a mouse coronal slice. Fluorescence variations within processes were analyzed in subregions of ~1 μm2 (red square) in a single z-plane. f Time-lapse Ca2+ imaging in an astrocyte process showing an example of Ca2+ event. Time between frames, 15 s. The black curve corresponded to the fluorescence signal recorded in a selected ROI (red square, first image). g Proportion of subregions displaying a calcium activity during a 5-min recording. Each dot corresponds to individual value for each recorded astrocyte (n = 7). h Artificial color superposition of focal Ca2+ events (1–4 contiguous subregions, blue) and expanded Ca2+ events (> 4 contiguous subregions, red) occurring during a 5-min recording in an astrocyte process, as defined by [8]. Traces showing occurrence of Ca2+ peaks in contiguous subregions with blue and red highlights identifying focal (blue) and expanded (red) Ca2+ events respectively. In physiological condition, focal events represent the major part of Ca2+ events within the astrocytic processes
