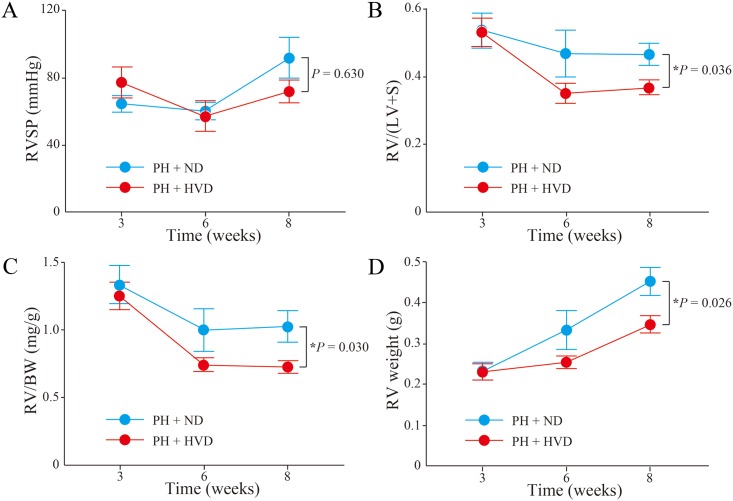
Fig 6. Time-course changes of PH and RV remodeling in PH rats.
Time-course data were compared between PH + ND group and PH + HVD group (n = 5–11 rats per group). (A) RV systolic pressure (RVSP). (B) The ratio of right ventricular weight to left ventricle plus septum weight [RV/(LV+S)]. (C) The ratio of right ventricular weight to body weight (RV/BW). (D) RV weight. Data are mean ± SEM. *P < 0.05.

