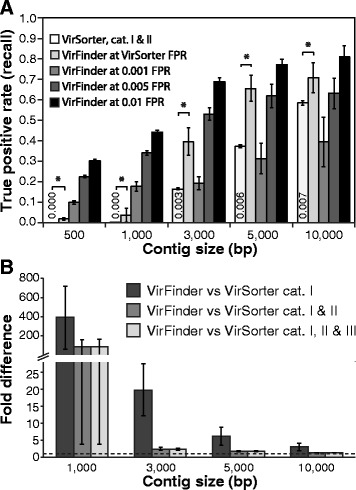
Fig. 2.

Performance of VirSorter and VirFinder virus prediction for contigs subsampled from virus and prokaryotic genomes. As input to each evaluation, equal numbers of contigs subsampled from virus and prokaryotic genomes were used for 30 replicate bootstrap samples. a The fraction of true viral contigs (true prediction rate (TPR)) identified by VirSorter using category I and II predictions and VirFinder at the same false positive rate (FPR) as VirSorter (listed in or above the VirSorter bars) and at FPRs of 0.001, 0.005, and 0.01. Bars depict mean values for 30 replicate bootstrap samples and error bars depict the standard error. Asterisk indicates the TPR of VirFinder is significantly higher (p < 0.001) than that of VirSorter at the same false positive rate (Wilcoxon signed-rank one-sided test). b The ratio between mean VirFinder and VirSorter true positive rates for category I; I and II; and I, II, and III where VirFinder FPRs were set at the corresponding FPRs of VirSorter predictions. Since VirSorter had no predictions for 500 bp contigs (TPR = 0), the ratio is infinite (not shown). Error bars depict mean standard error, and the red line shows a ratio of 1
