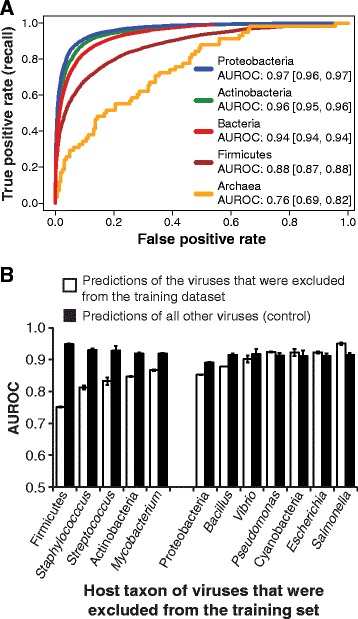
Fig. 3.

Differences in VirFinder’s performance for different groups of viruses and when excluding particular viruses from the training of VirFinder a ROC curves for VirFinder prediction results based on contigs subsampled from viruses isolated on particular host domains and phyla. Curves depict mean results for 30 replicate samples each. Numbers in the legend indicate mean AUROC values and numbers in brackets indicate the upper 2.5% quantiles for 30 replicate bootstrap samples. b Viruses that infect four major phyla and eight major genera of hosts were each excluded from the dataset of sequences used to train VirFinder. AUROC scores were then determined when making VirFinder predictions on contigs of the excluded viruses when they were mixed with equal numbers of contigs of other viruses and equal numbers of host contigs as the total number of viral contigs. As a control, AUROC scores were compared to results of predictions of all other viruses. Contigs for the training and evaluating datasets were sampled at a length of 1000 bp, and predictions were made for 30 replicate datasets for each taxon analysis
