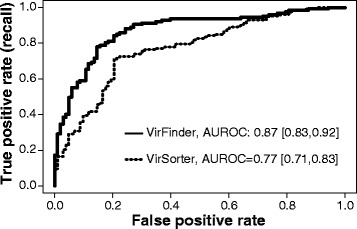
Fig. 6.

ROC curves and AUROC scores for classifying healthy and liver cirrhosis patients based on abundance profiles of predicted viral contig bins. The models were trained using averaged bin coverage (averaged RPKM of contigs in the bin) of 78 samples of health and diseased patients and then tested on an independent set of 230 samples from the same study. Each set of 2657 viral contigs predicted by VirFinder and VirSorter were separately binned based on sequence tetranucleotide frequencies and contig coverages normalized by contig length and number of mapped reads in samples. The numbers in the square brackets are the lower and upper 2.5% quantiles
