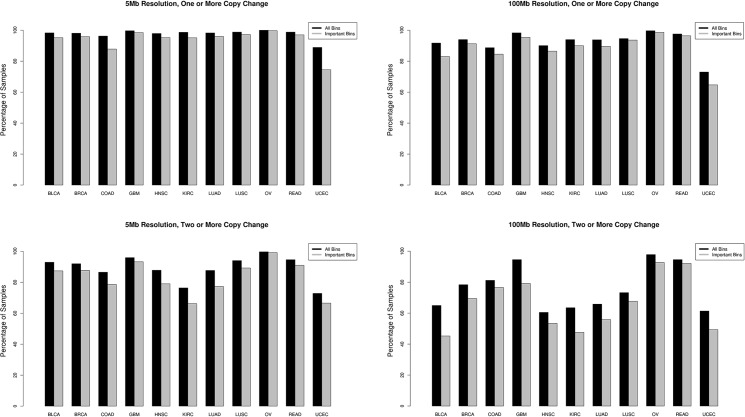
Fig 2. Percentage of cancer samples with ctDNA detectable CNV events.
The fraction of samples with at least one detectable CNV event (top panels) or two and more detectable CNV events (bottom panels) at 5 Mb (left panels) and 100 Mb (right panels) resolution are plotted per cancer type. All CNV events were considered (black) as well as only those deemed important for cancer type discrimination by our random forest model (grey).

