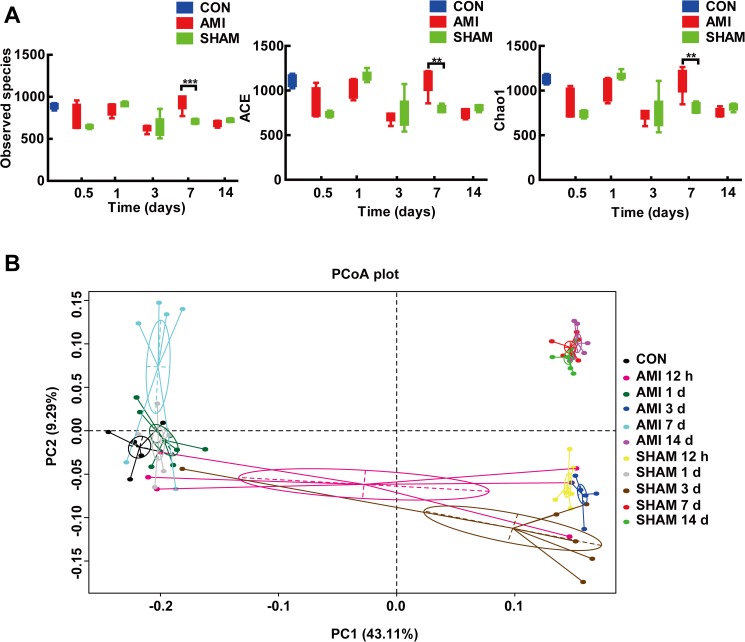
Fig 2. The microbial changes after AMI.
(A) The richness index (including Observed species, ACE and Chao1) in different groups. The richness of AMI group was significantly higher than that of SHAM group at 7 d post-operation. ** P<0.01; *** P<0.001. (B) Principal coordinate analysis (PCoA) of gut microbiota showed that the microbial communities of AMI group at 7 d post-AMI clustered distinctly from SHAM group at 7 d. One circle represents microbiota composition (all phyla combined) in one subgroup (n = 6, one dot represents one sample). CON, control group; AMI, acute myocardial infarction group; SHAM, sham group.

