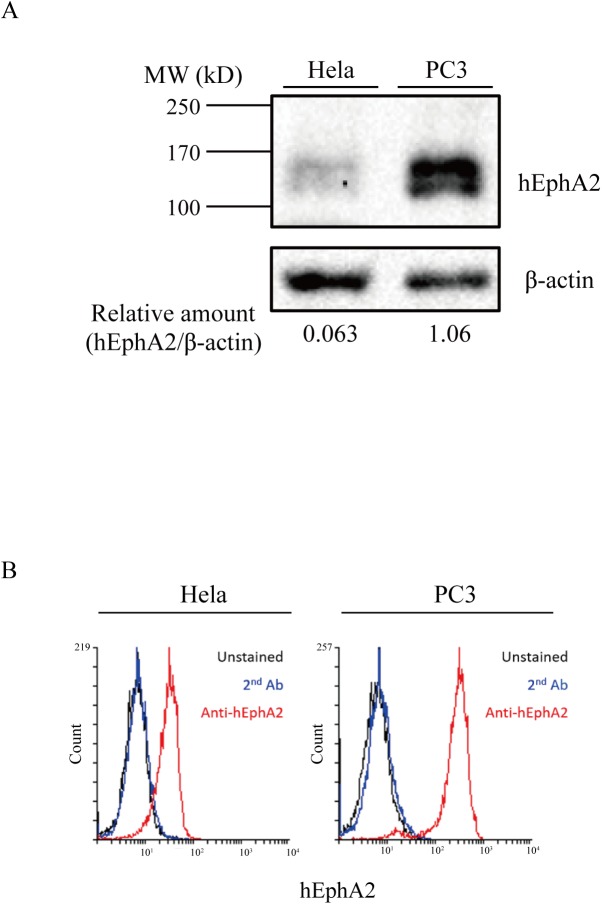
Fig 2. hEphA2 expression in tumor cells.
(A) Western blot analysis of hEphA2. Lysates of PC3 and HeLa cells (8 × 10⁵) were separated by SDS-PAGE and transferred to nylon membranes. Membranes were stained with rabbit anti-hEphA2 or β-actin antibodies. (B) Flow cytometric analysis of cells. Cells (5 × 10⁵) were stained with mouse anti-hEphA2 and Alexa 488-conjugated anti-mouse IgG antibodies (anti-hEphA2), and fluorescence was measured by flow cytometry. Unstained cells or cells stained with Alexa 488-conjugated anti-mouse IgG antibody (2nd Ab) alone were used as controls.

