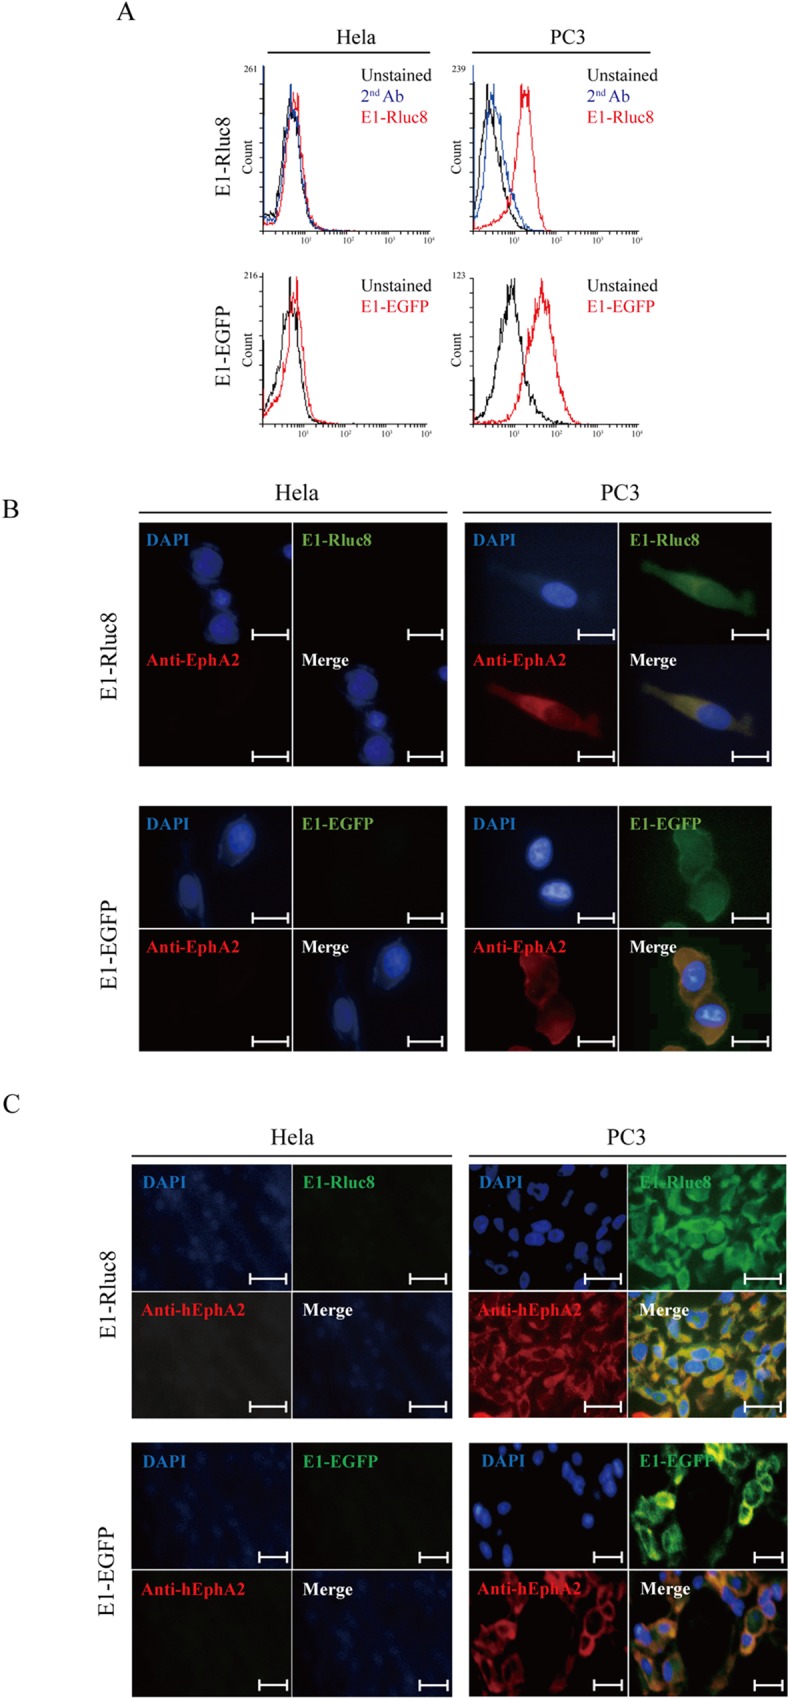
Fig 3. E1-reporter monobody cell binding.

(A) Flow cytometric analysis of cells treated with E1-Rluc8 and E1-EGFP. PC3 and HeLa cells (5 × 10⁵) detached from culture plates were treated with E1-Rluc8 and E1-EGFP. The cells treated with E1-Rluc8 were stained with FITC-conjugated mouse anti-6×His antibody. Unstained cells or cells stained with FITC-conjugated secondary antibody (2nd Ab) alone were used as controls. (B) Fluorescence microscopy images of the cells. PC3 and HeLa cells were stained with mouse anti-hEphA2 antibody and E1-Rluc8, and then detected with Alexa 555-conjugated anti-mouse IgG (red) and FITC-conjugated anti-6×His antibodies (green). Cell nuclei were stained with DAPI (blue). Scale bar, 10 μm. (C) Fluorescence microscopy images of xenograft tumor tissues. PC3 tumor tissues from transplanted nude mice were stained with the antibody combinations used in (B). Scale bar, 10 μm.
