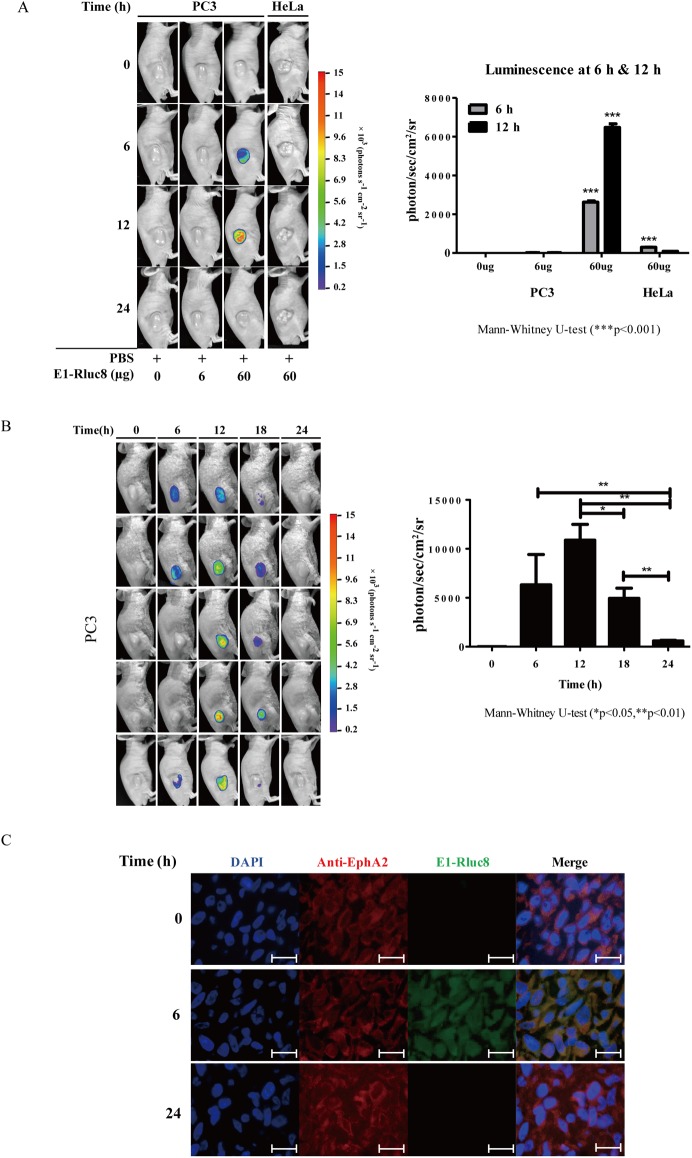
Fig 5. In vivo imaging analysis with the E1-reporter monobody in tumor xenograft mice.
(A) Measurement of luminescence in mice injected with different concentrations of E1-Rluc8. PC3 and HeLa cells were transplanted into 6-week-old Balb/c nude mice via subcutaneous injection (n = 3). After tumor formation, the indicated amounts of E1-Rluc8 and coelenterazine were intravenously injected via the tail vein, and luminescence images were acquired at the indicated times with the NightOWL in vivo imaging system (left). The luminescence intensities measured in tumor areas at 6 h were graphed (right). (B) Luminescence maintenance in mice injected with E1-Rluc8 for 24 h. E1-Rluc8 (60 μg) and coelenterazine were intravenously injected via the tail vein into PC3 tumor mice (n = 5), and luminescence images were obtained at the indicated times (left). The luminescence intensities in tumor tissues were measured with the NightOWL in vivo imaging system and graphed (right). (C) Detection of the remaining E1-Rluc8 in PC3 tumor tissues. Tumor tissues were collected at the indicated times from mice injected with E1-Rluc8 and stained with FITC-conjugated anti-6×His antibodies (green). hEphA2 was stained with mouse anti-hEphA2 antibody and Alexa 555-conjugated anti-mouse IgG (red). Cell nuclei were stained with DAPI (blue). Scale bar, 10 μm.

