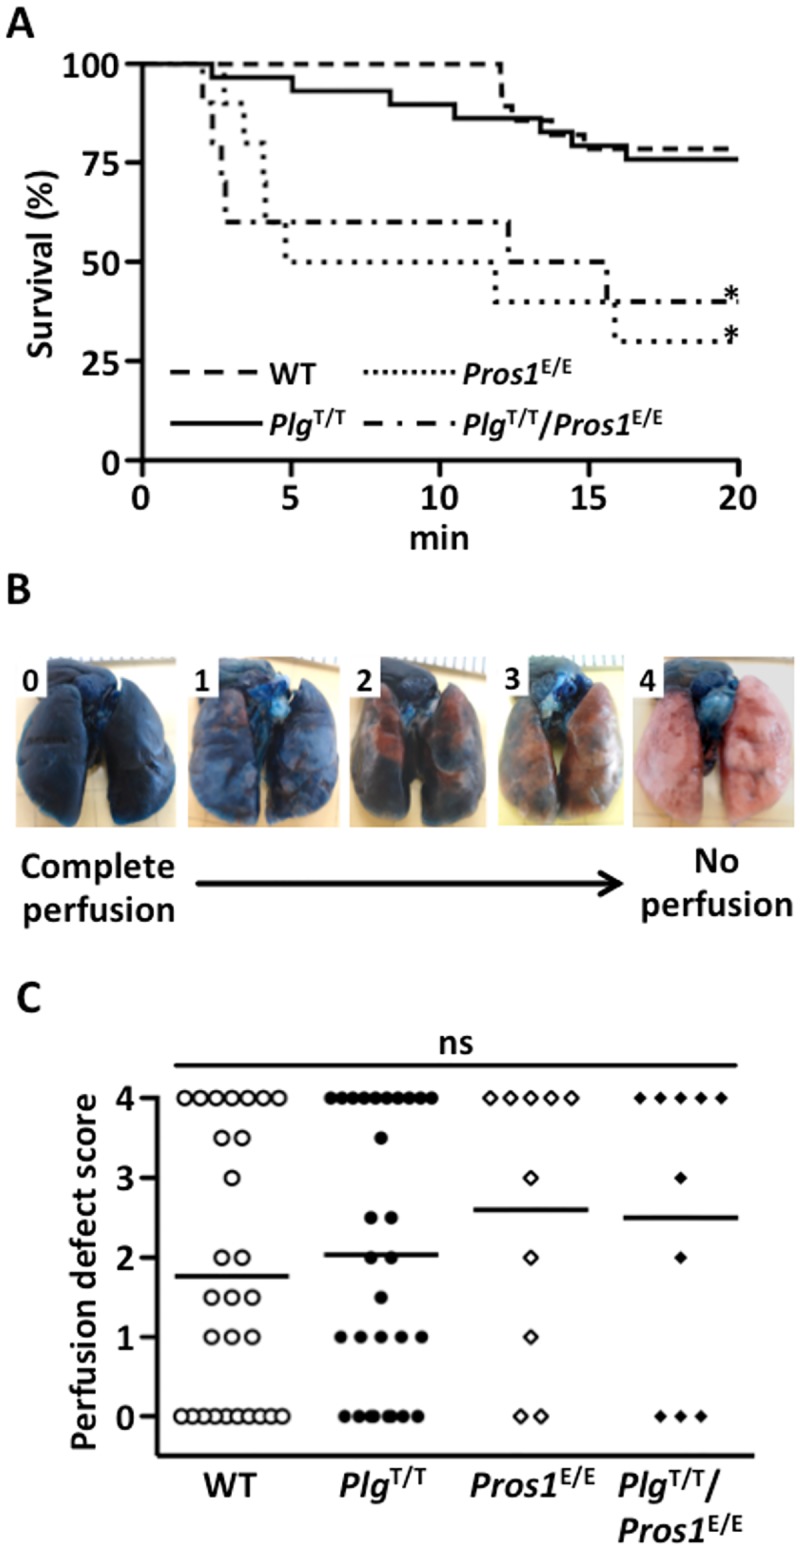
Fig 5. Survival time and lung perfusion defect after tissue factor-induced PE.

(A) After the tissue factor infusion via IVC, the survival time was recorded until 20 min. No significant difference was observed in the survival between wild-type (WT) (n = 28) and PlgT/T (n = 29) mice (hazard ratio, 1.18; 95% confidence intervals, 0.40–3.50), or between Pros1E/E (n = 10) and PlgT/T/Pros1E/E (n = 10) mice (hazard ratio, 0.81; 95% confidence intervals, 0.27–2.41). The survival rates of both WT and PlgT/T mice were significantly longer than those of Pros1E/E and PlgT/T/Pros1E/E mice (WT and Pros1E/E mice: hazard ratio, 5.43; 95% confidence intervals, 1.81–16.28; WT and PlgT/T/Pros1E/E mice: hazard ratio, 4.38; 95% confidence intervals, 1.41–13.60; PlgT/T and Pros1E/E mice: hazard ratio, 4.62; 95% confidence intervals, 1.61–13.28; PlgT/T and PlgT/T/Pros1E/E mice: hazard ratio, 3.73; 95% confidence intervals, 1.25–11.11). *Significant difference in comparison to WT mice and PlgT/T mice. (B) The scale used to measure lung perfusion defect scores. A score of 0 indicates complete perfusion of Evans blue with no occlusion and a score of 4 indicates no Evans blue perfusion with complete occlusion. (C) Perfusion defect scores. No significant (ns) differences (p > 0.05) were observed among WT (n = 28), PlgT/T (n = 29), Pros1E/E (n = 10) and PlgT/T/Pros1E/E mice (n = 10). Perfusion defect scores were assessed by the Mann-Whitney test. Circles and diamonds represent individual mouse data. Bars represent the mean values of groups.
