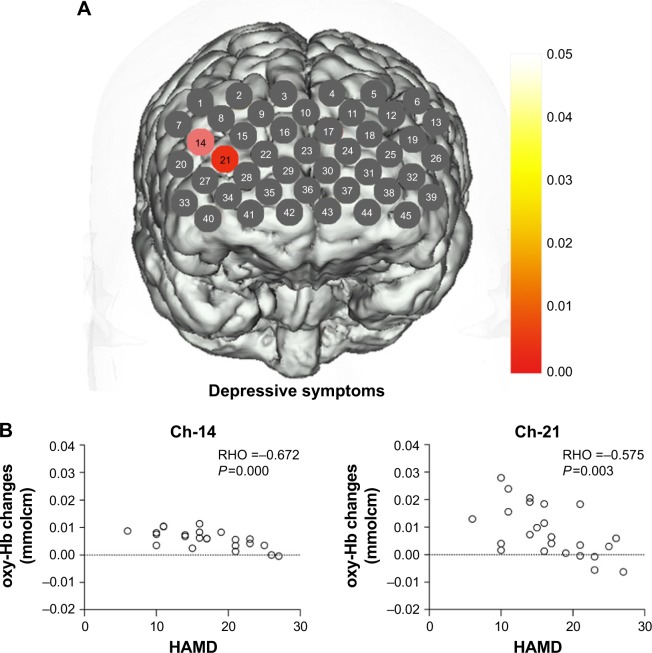
Figure 4.
(A) Correlation between oxy-Hb changes with HAMD scores. (B) Scatter plot of the oxy-Hb changes in channels 14 and 21 changing with HAMD scores.
Note: Channels in red show that oxy-Hb changes were negatively correlated with HAMD scores.
Abbreviations: HAMD, Hamilton Rating Scale for Depression; oxy-Hb, oxygenated hemoglobin.

