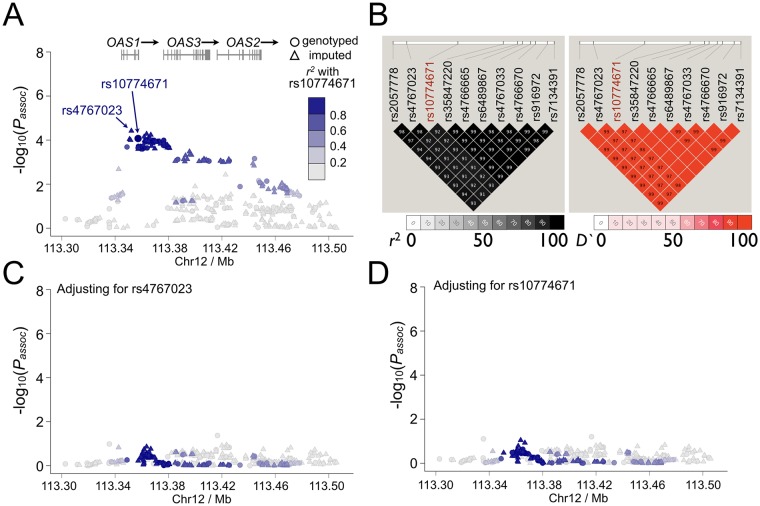
Fig 4. Results of genetic association analyses in OAS1 region.
(A) Genetic association analyses were performed using Dataset 1 (765 SS cases and 3,825 controls). The most significant association before and after imputation was at rs10774671 (Passoc = 8.47×10⁻⁵) and rs4767023 (Passoc = 3.82×10⁻⁵), respectively. (B) The LD structure of the OAS1 region indicated by r2 and D' for SS-associated variants with Passoc<1×10⁻⁴ are shown. All these variants, including the top SS-associated genotyped SNP rs10774671, were in strong LD (r2>0.9). (C, D) In order to determine independency of the association signals observed in the OAS1 region, we performed logistic regression analyses adjusting for the top SS-associated variants in the OAS1 region. Adjusting for any variant with Passoc<1×10⁻⁴ could account for all other associations in the extended OAS1 region (200kb). Examples shown here are conditional analyses adjusting for rs4767023 and rs10774671, respectively. The associations of each variant with SS were plotted based on -log10(Passoc) values. The r2 coded by colors indicating LD with the top SS-associated genotyped SNP rs10774671 are given in the figures.

