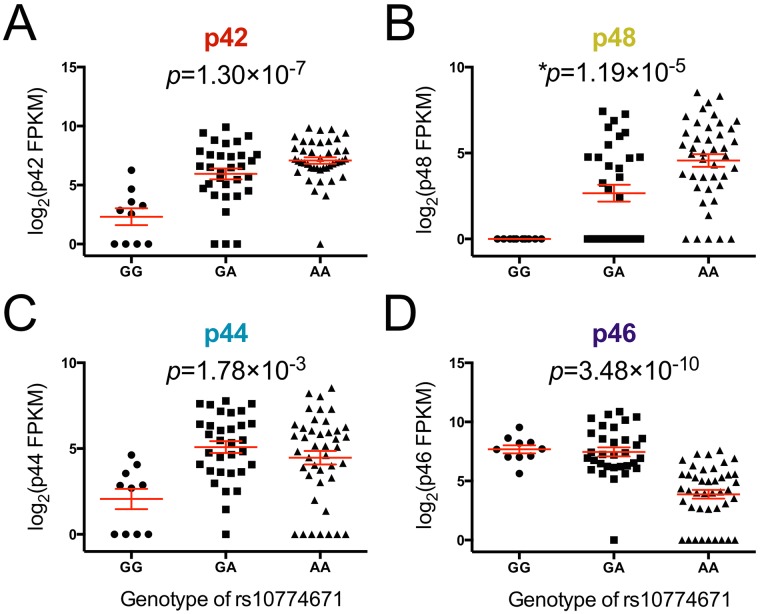
Fig 5. Correlation of rs10774671 with expression levels of each OAS1 isoform.
The expression level of each isoform was determined using RNA-seq. The abundance of each isoform was measured by FPKM in Cufflinks and was compared between individuals with different genotypes of rs10774671. The risk allele A of the SS-associated variant rs10774671 was correlated with higher transcript expression of (A) p42, (B) p48, and (C) p44 isoforms, but lower levels of the (D) p46 isoform. The P value for each analysis was determined using one-way ANOVA except for p48 (as all samples in the GG group have zero values, Kruskal-Wallis test was used for p48, not assuming equal standard deviation across groups). The mean value and standard error of the mean of each group are plotted in red. The results were replicated using quantitative real-time PCR with primer sets targeting specific OAS1 isoforms (S4 Fig; S3 Table).

