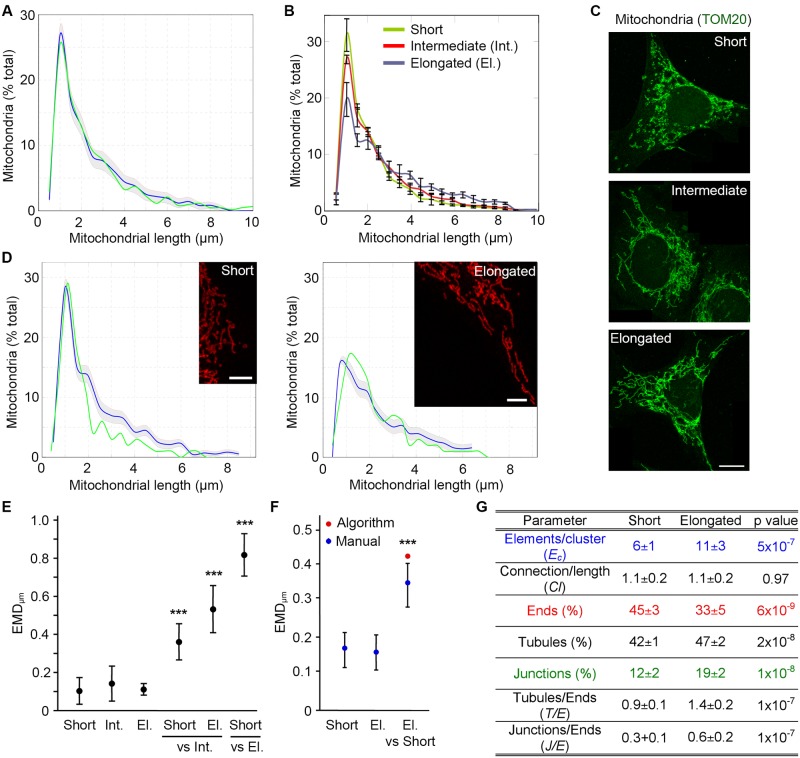
Fig 3. The algorithm identifies mitochondrial length and connectivity in sample images from cells.
(A-D) MEFs were stained for the mitochondrial marker TOM20 and imaged. Mitochondrial length was then determined in 8 whole cells manually (Green line) and using the algorithm (Blue line, confidence interval in grey) (A). Cells were then binned as containing short, intermediate or elongated mitochondria and analysed with the algorithm (B, distribution (3 cells/type ± SD); C, representative images). Scale bars 10 μm. Alternatively, we manually quantified mitochondrial length in portions of cells with well-defined mitochondria and classified them as short or elongated mitochondrial networks. Images from the same category were pooled to generate a mitochondrial profile (D; Green, manual determination; Blue, algorithm; Grey, confidence interval). Manual counts represent the average of at least 5 images. (E-F) EMD quantification of the differences between distribution types in whole cells (E) and image sections (F). EMD values were first calculated between each cell within a distribution type and the average for that distribution, to calculate the experimental variation (first 3 data points (E); first 2 data points (F)). To calculate the EMD between distribution types, each cell within a distribution type was then compared to the average for each of the other distributions (Short/El. vs Nit and Short vs El. (E); El. vs Short (F)). Data is expressed as the average EMD value ± S.D. *** p<0.001. El.: Elongated; Int.: Intermediate. (G) Parameters for the short and elongated mitochondrial networks in (B-C).

