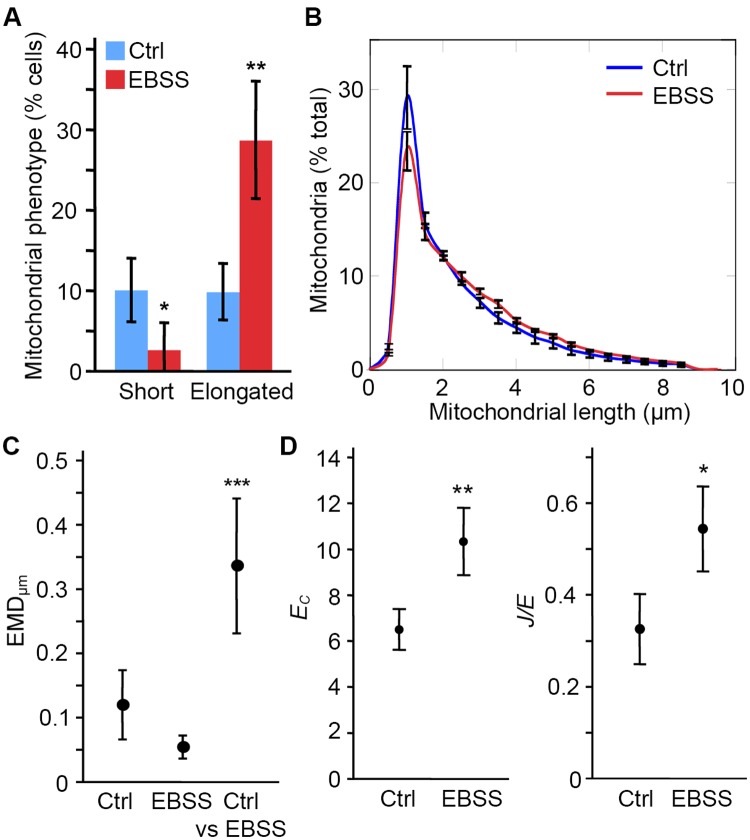
Fig 4. Starvation increases mitochondrial length and connectivity.
To induce a starvation response, MEFs were incubated for 4 hours in EBSS. Control and EBSS-treated cells were then stained for the mitochondrial marker TOM20 and imaged. (A) Individual cells were manually counted as having a short, intermediate or elongated mitochondrial network. Data is expressed as the average % of cells within each category ± S.D.; n = 3 independent experiments. (B) Quantification of mitochondrial length by the algorithm. Data is shown as the average of 3 independent experiments ± SD. (C) EMD quantification of the distribution shift between control and EBSS-treated cells. The experimental variation was first calculated by comparing the average distribution of each experiment (n = 3) to the average of the 3 experiments for a same treatment (Ctrl, EBSS). The variation between Ctrl and EBSS was then measured by comparing the distribution of a given treatment in individual experiments to the average distribution for the other treatment (Ctrl vs EBSS). Data is expressed as the average EMD value ± S.D. *** p<0.001 (D) Starvation increases both EC and J/E. Data is expressed as the average of 3 experiments ± S.D. * p<0.05; ** p<0.01.

