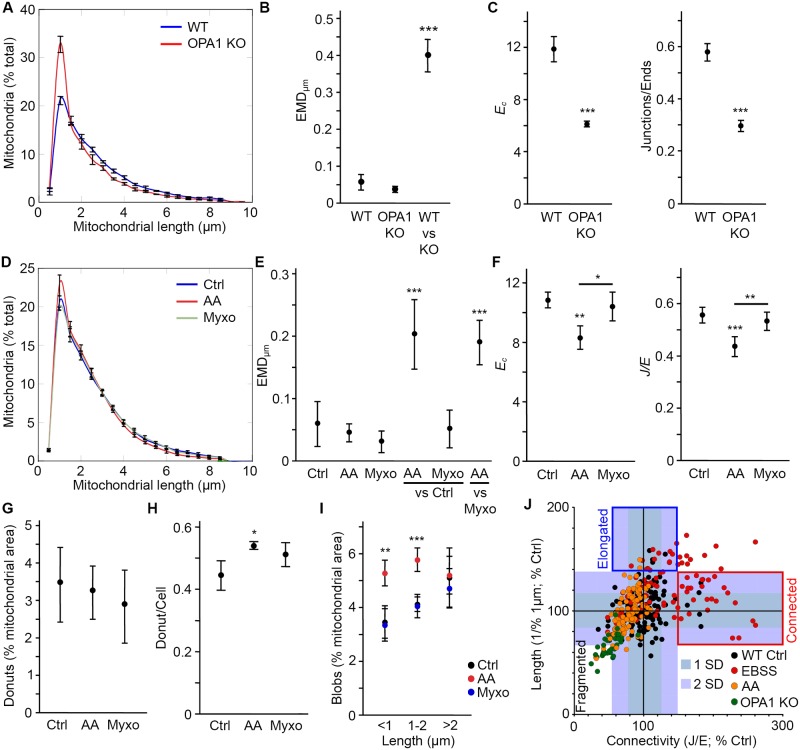
Fig 5. AA but not Myxo induces mitochondrial fragmentation in U2OS cells.
(A-B) OPA1 KO mitochondria are fragmented. WT and OPA1 KO MEFs were stained using the mitochondrial marker TOM20 and imaged. Mitochondrial distributions (A) and EMD quantification of the shift in distribution between WT and KO cells (B; WT and OPA1 KO, experimental variation; WT vs KO, variation between genotypes) were then determined as for EBSS treatments (Fig 4). Data is expressed as the average of 3 independent experiments ± SD. *** p<0.001. (C) Changes in EC and J/E correlate with mitochondrial fragmentation. Data is expressed as the average of 3 independent experiments ± S.D. *** p<0.001. (D-E) Decreased mitochondrial length in U2OS cells treated with the Complex III inhibitor AA. Cells were treated for 4 hours with AA or Myxo, then fixed and analysed as in (A-B). Data is expressed as the average of 3 independent experiments ± SD. *** p<0.001. For EMD scores (E), Ctrl, AA and Myxo refer to the experimental variation while AA/Myxo vs Ctrl and AA vs Myxo measure the change in distribution between treatments. (F) AA, but not Myxo, decreases mitochondrial connectivity as measured by EC and J/E values. Data is expressed as the average of 3 independent experiments ± S.D. *** p<0.001, ** p<0.01, * p<0.05 compared with the control or AA where indicated. (G-I) Changes in specific mitochondrial structures following AA treatment. Donuts (mitochondria looped on themselves) were measured by the algorithm (G) or manually (H) and the result expressed as the average of 3 independent experiments ± S.D. Blobs (isolated mitochondria (EC = 3) with a length <1 μm) were measured using the algorithm (I). Short isolated mitochondria with lengths between 1 and 2 μm, were also increased following AA treatment. Data is expressed as the average of 3 independent experiments ± S.D. *** p<0.001, ** p<0.01 compared to control. (J) Relationship between connectivity and length across different experimental conditions in individual cells. J/E ratios were used as the connectivity parameter. For length, we used the number of mitochondria in the 1 μm bin because this value correlates well with mitochondrial fragmentation. However to have an increasing value with increasing length, we used 1/this number. To allow comparison between experiments, all values were normalised to the control for that experiment. The shaded areas represent 1 SD and 2 SD from the control values. Individual cells from at least 3 experiments/conditions are shown.

