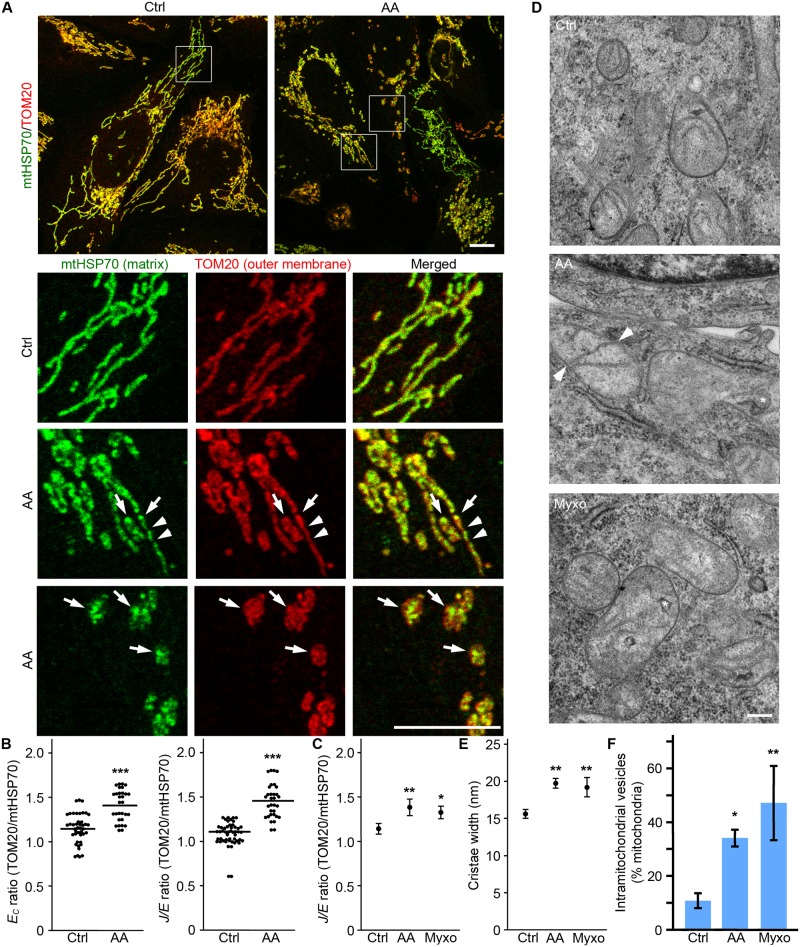
Fig 6. Differences in outer and inner membranes can be used to detect changes in cristae/matrix structure.
U2OS cells were treated for 4 hours with AA or Myxo, then fixed and stained for the outer membrane marker TOM20 (Red) and the matrix protein mtHSP70 (Green). Representative images are shown in (A). Arrows denote sites where mtHSP70 accumulates; arrowheads, sites of inner membrane fission where TOM20 staining remains continuous. Scale bar 10 μm. (B) Quantification of the difference in EC and J/E ratios between TOM20 and mtHSP70 staining. These parameters were calculated from control mitochondria with overlapping signals and AA treated cells showing distinct patterns of TOM20 vs mtHSP70 staining (as in the lower two panels in (A)). Data is expressed as the ratio of Parameter(TOM20)/Parameter(mtHSP70). (C) J/E ratio is increased following Complex III inhibition. Data is expressed as the average of 4 independent experiments ± S.D. ** p<0.01, * p<0.05. (D-F) Mitochondrial untrastructure changes are present following Complex III inhibition. U2OS cells were treated as in A and processed for EM. Cristae width (E) and the number of mitochondria with intramitochondrial vesicles (F) quantified as the average of 3 experiments ± S.D. ** p<0.01, * p<0.05. Representative images are shown in D. Asterisks denote intramitochondrial vesicles and arrowheads, sites where cristae are connected to both sides of a mitochondrion.

