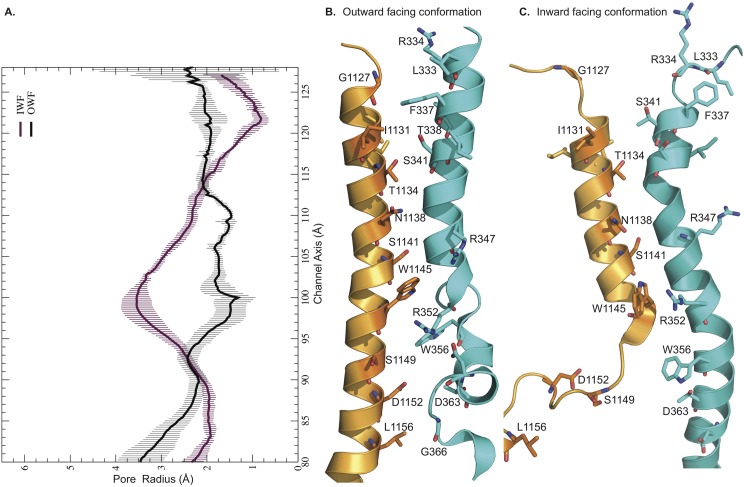
Fig 2. Pore profiles of CFTR channel in outward and inward-facing conformations.
Relative positions of TMHs 6 and 12 from 200th ns structures: A. Average pore profiles from corresponding MD trajectories, B. OWF, and C. IWF conformations. These radius profiles are calculated using 200 snapshots from the last 100 ns production run by applying HOLE software. Black and purple curves depict the pore profiles of the outward- and inward-facing states, respectively.

