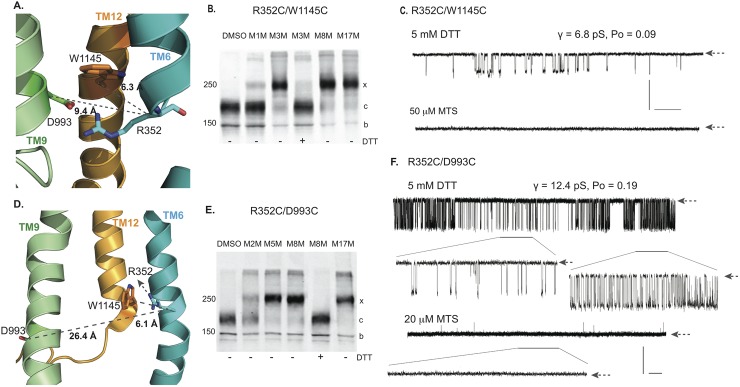
Fig 5. Cross-linking of membrane spanning helices 6, 9 and 12.
A. Relative positions of R352 in TMH6, D993 in TMH9, W1145 in TMH12 in outward facing state. B. Western blot of Cys-less CFTR R352C/W1145C before (lane 1) and after treatment with 20 μM of MTS cross linkers (lanes 2, 3). No change in mature band (c) position before treatment indicates that there is no spontaneous disulfide bond formation between R352C and W1145C while M3M, M8M and M17M treatment cause a strong shift of the c band to the higher molecular weight band cross-linked form (x band). C. Single channel recordings showing γ = 6.8 pS under reducing conditions (DTT; upper tracing) or non-conductive state as a result of cross-linking by 50 μM M3M (lower tracing). D. Positions of R352, D993 and W1145 in the inward facing state. E. Western blot of Cys-less CFTR R352C/D993C before (lane 1) and after treatment with MTS (20 μM) cross linkers (lanes 2–4). No c band appears without cross-linker addition indicating that a spontaneous disulfide bond is not formed. F. 10 min single channel recording under reducing conditions (DTT; upper tracing). Two segments with different gating kinetics and Po but identical γ = 12.4 pS with extended time scale are labeled by bars and shown below the upper trace in the extended time scale. No opening is observed after addition of 20 μM M5M reagent from the “cis” side (middle tracing). Blank recording of 60s segment in extended time scale (lower tracing). Single channel closed states are shown by arrows at the right end of each trace. Vertical (Y-axis) scale bar represents 1pA for all traces is shown on right. Horizontal (X-axis) scale bars are different for each trace: 30s for the topmost trace and 10s for the bottom traces (see also S6–S8 Figs).

