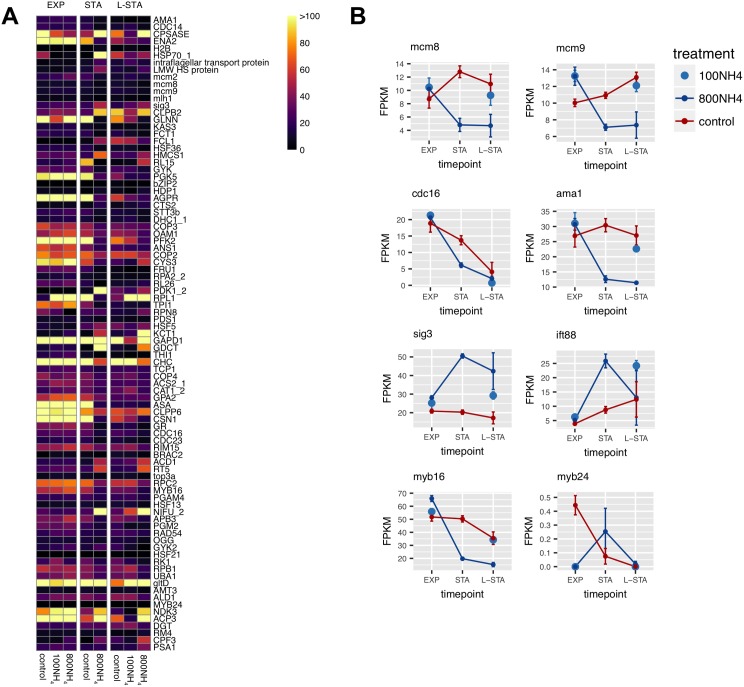
Fig 5. Transcriptomic evidence for sexual reproduction in T. pseudonana.
A: Heat map of 89 genes having annotated functions that were differentially expressed during differentiation and sexual reproduction in T. pseudonana CCMP1335. Color indicates normalized expression value (FPKM) for each nitrogen treatment (control = 100 μM NO3-; 100NH4 = 100 μM NH4+; 800NH4 = 800 μM NH4+) and growth phase (EXP, STA, L-STA). B: FPKM values of select genes across growth phases for each nitrogen treatment.

