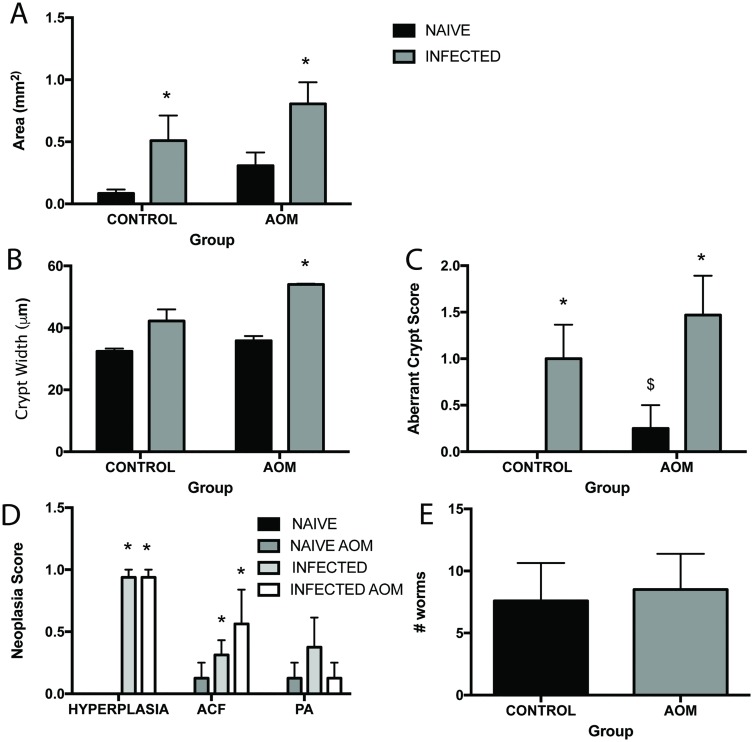
Fig 2. Chronic T. muris infection exasperates epithelial neoplasia in the colon carcinoma AOM model.
C57BL/6 mice at day 80 p.i. treated with AOM or PBS control. A Total area of lamina propria and epithelium in the intestine. B Crypt width in the caecum and colon. C Aberrant crypt score in caecum and colon. D Neoplasia score based on extent of hyperplasia, numbers of aberrant crypt foci (clusters) and numbers of pre-adenomas in caecum and colon. Black bars denote naïve animals and grey bars denote infected animals. E Numbers of worms in control (black bars) and AOM (grey bars) treated mice at day 80 p.i. * significant difference between naïve and infected animals p<0.05, $ significant difference between naïve animals in PBS and AOM groups p<0.05. n = 4–8 per group.

