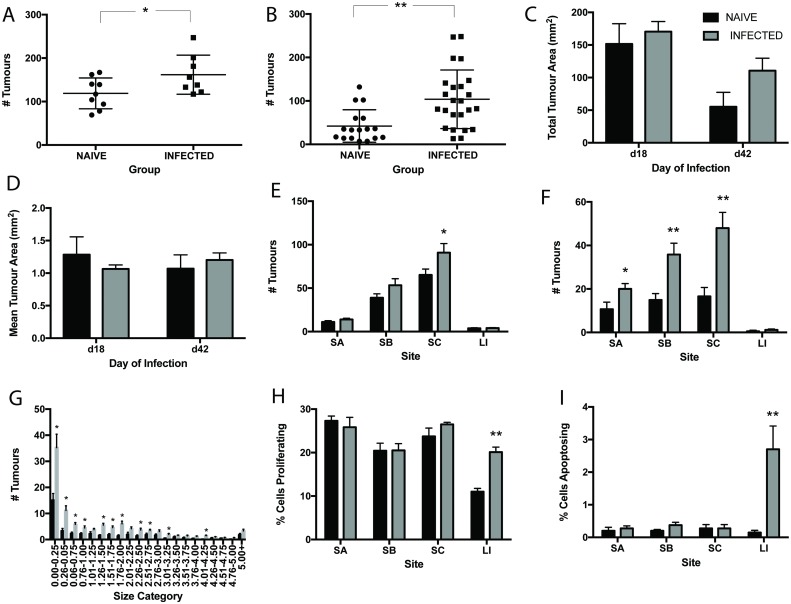
Fig 3. Chronic T. muris infection promotes the development of intestinal neoplasia in APCmin/+ mice.
T. muris infection at day 18 p.i. and day 42 p.i. in APCmin/+ mice. A Total number of tumours in the intestines of naïve and infected mice at day 18 p.i. B Total number of tumours in intestines of naïve and infected mice at day 42 p.i. C Total tumour area in intestines of naïve and infected mice at d18 and d42 p.i. D Mean tumour area in intestines of naïve and infected mice at d18 and d42 p.i. E Number of tumours in regions of the intestine in naïve and infected mice at day 18 p.i. SA upper, SB mid, SC lower small intestine and LI large intestine. F Number of tumours in regions of the intestine in naïve and infected mice at day 42 p.i. G Size frequency distribution of tumour size between naïve and infected animals at day 42 p.i. H Percentage of proliferating cells in regions of the intestine at day 42 p.i. I Percentage of apoptopic cells in regions of the intestine at day 42 p.i. Black bars denote naïve and grey bars denote infected animals, * significant difference between naïve and infected animals p<0.05, ** p<0.005. APCmin/+ mice from the Paterson Institute, Manchester UK. n = 8–13 per group and repeated twice.

