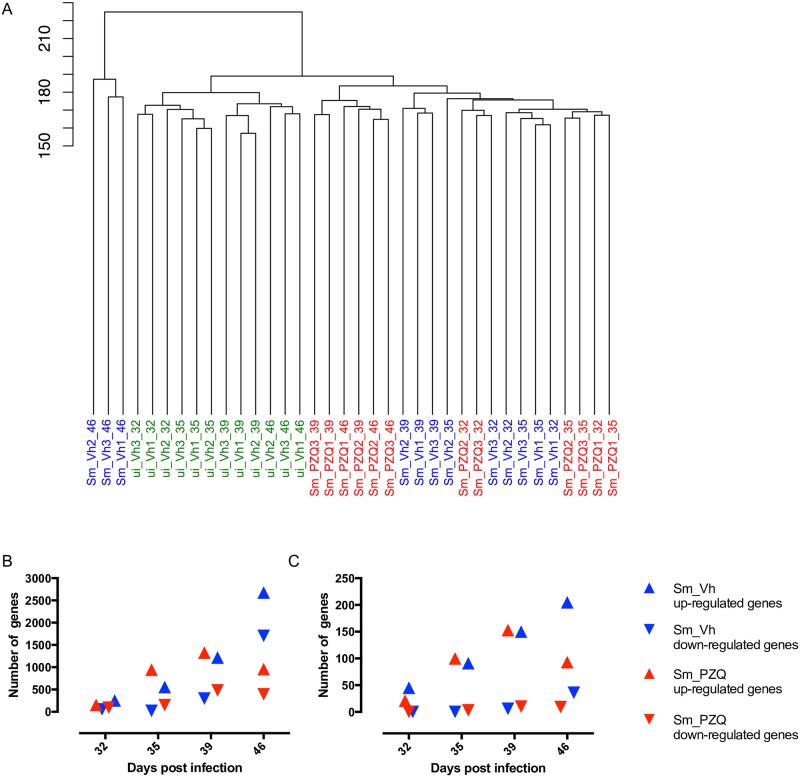
Fig 2. Hierarchical clustering of gene expression between different treatment groups and differentially expressed genes.
(A) Dendrogram showing global similarities between hepatic transcriptomic replicates (n = 3) of uninfected Vh treated (ui_Vh), infected Vh treated (Sm_Vh) and infected PZQ treated (Sm_PZQ) mice at days 32, 35, 39 and 46 post infection. (B) The total number of up- and down-regulated hepatic genes in Vh and PZQ treated mice compared to uninfected Vh treated control samples at days 32, 35, 39 and 46 post infection. (C) The total number of up- and down-regulated immune genes identified by GO analysis in Vh and PZQ treated mice compared with uninfected Vh treated control samples at days 32, 35, 39 and 46 post infection.

