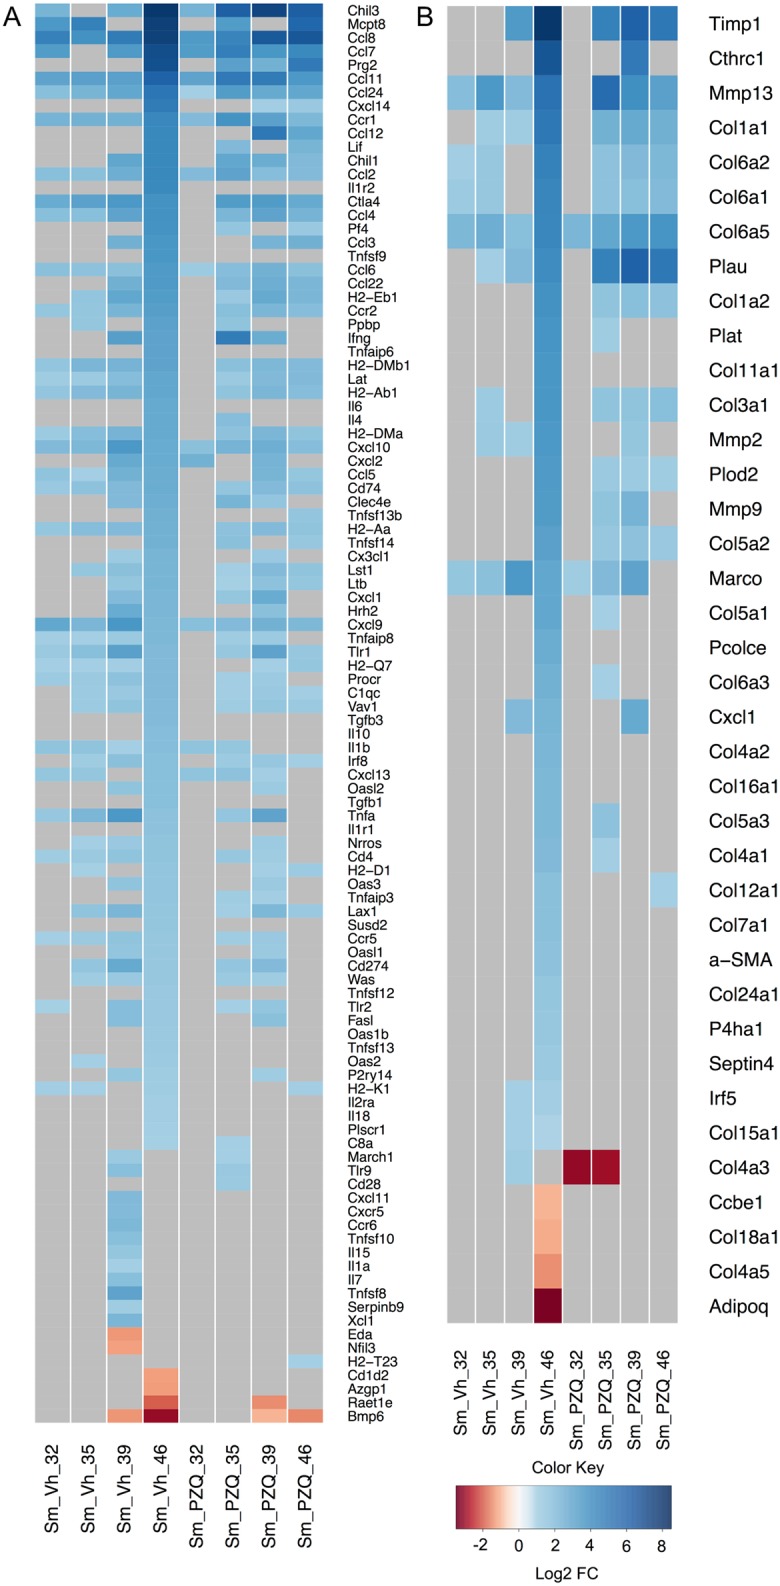
Fig 3. Temporal expression of mouse hepatic genes during infection with S. mansoni.

Heat maps of (A) immune and (B) fibrotic gene markers depicting differentially expressed genes in infected Vh and PZQ treated mice relative to uninfected mice. Gray map sections represent genes not expressed at that time point or in that treatment group. Regions of blue and red indicate, relative to uninfected Vh treated controls, increased and decreased gene expression respectively. The color scale indicates log2 fold change (FC) and the profile of each group is the average of three biological replicates. Gene names associated with the figure differ slightly from those used in the text. Relevant differences include: Ccl (rather than CCL as it appears in the main body of text), Cxc (CXC), Cxcl (CXCL), Il1b (IL1β), Tnfa (TNFα), Tgfb (TGFβ), Ifng (IFNγ), Cd (CD) and Timp (TIMP).
