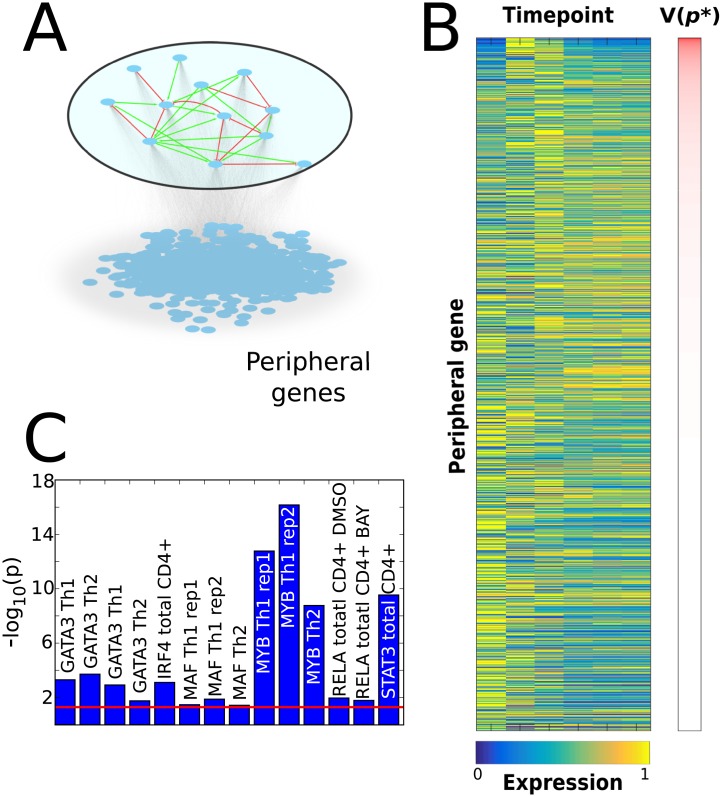
Fig 3. LASSIM inferred a genome-wide model of 35,900 core-to-peripheral gene interactions.
(A) These peripheral genes do not have any feedbacks to the core system, nor any crosstalk among themselves. (B) The measured mRNA profiles of the 10,543 peripheral genes (blue/yellow represent relative low/high expression), sorted by the model cost (V(p*)) on the y-axis, and time points on the x-axis. As can be seen, genes that display a peak in expression at the second or third time points are generally associated with a higher cost. (C) The results from the ChIP-seq analysis of inferred to-gene interactions, where the y-axis shows the—log10(p). The red line denotes the significance level (Bootstrap P < 0.05).

