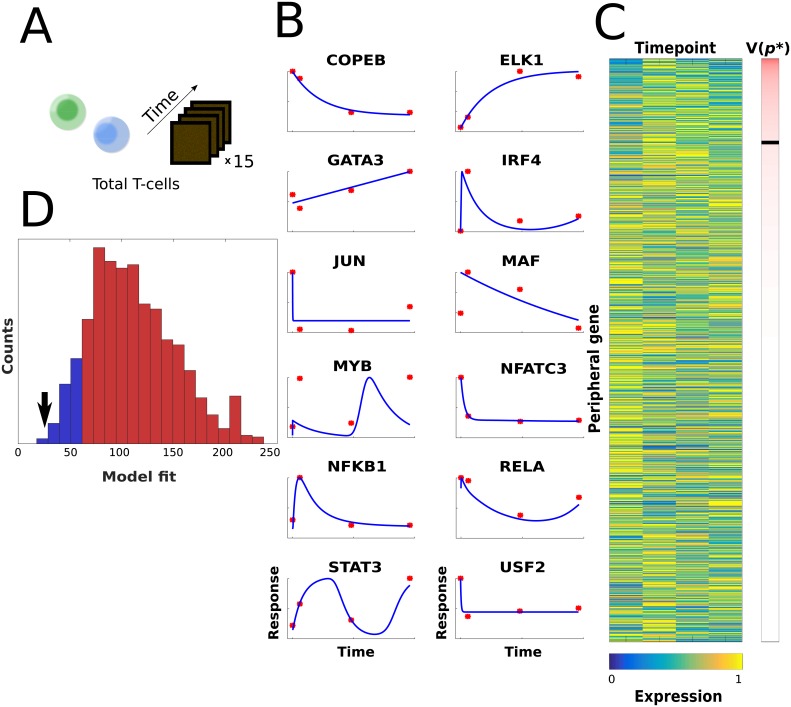
Fig 4. The edges from the naïve Th2 model were better refitted to total Th2 differentiation than the prior network.
(A) We refitted the core network to new time-series data from total Th2-cells by keeping the signs of the inferred minimal Th2 model. (B) The fit of the core model to the total T-cell data is shown. The y-axis has arbitrary units of expression, and the x-axis is time. The model output is denoted by the blue curves, and the data are shown by the red points. (C) The fit of the peripheral genes. The figure follows the same style as in Fig 3B. The black band in the cost bar denotes the 0.95 rejection limit of the corresponding χ2-test, with all rejected models above the band. (D) We resampled our prior matrix with the same number of parameters and signs as the Th2 model 10,000 times, and compared the random models with the output from LASSIM. The ability of the inferred core network structure to fit novel gene expression data of total T-activation was considered. A total of 1 000 random core model structures were drawn from the prior network, and refitted to the data. The distribution of the fit is shown by the blue curve. The core network identified from LASSIM was shown to be significantly better for fitting the novel data, as marked by the black arrow. Moreover, most of the core models could be rejected by a χ2-test, and are represented in red.

